Extension exercises: analysing #climatechange using Tableau and Gephi

The QUT Digital Media Research Centre (DMRC) has been running various digital methods training workshops internally as well as externally through the CCI Digital Methods Summer School and the Association of Internet Researchers Conference last year in Phoenix and coming up again this year in Berlin as part of #AoIR2016.

As an extension to these workshops and the free Social Media Analytics course we are running on the FutureLearn platform (starting on 18 July), we are sharing some exercises that will allow you to examine different parts of a network graph generated from Twitter data. We assume people following these exercises are already familiar with both Tableau and Gephi and have completed one or more of our workshops, or have enrolled in and completed our FutureLearn course.

We are assuming that you are working with a dataset that you have created in earlier steps of the course or workshop, and that you have already undertaken preliminary analysis on your data. The following exercises are a step-by-step guide to techniques that can be used to explore Twitter networks in more depth, as well as to better understand social network analysis concepts such as betweenness, eccentricity and centrality.

You can download or view the exercises in PDF here:

Gephi_Exercise1

Gephi_Exercise2

Gephi_Exercise3


#ausvotes 2016: Some Early Impressions

We’re now well into one of the longest Australian election campaigns in recent memory, and close enough to election date that we should expect the general public and not just the usual political junkies to begin engaging with the parties’ campaigns. Time, then, to examine how the parties are faring on social media to date.

We’re focussing here on Twitter, where we have been tracking the tweets posted by and @mentions (including retweets) directed at all the election candidates we have been able to identify to date. Because candidate nominations only closed on 9 June, with the major parties publishing their confirmed candidate lists somewhat earlier, our substantive tracking commenced on 25 May, with more minor party candidates added as their Twitter accounts are being identified. The focus of this first update, therefore, is especially on activities around Labor and Coalition candidates.

The overall patterns we have been able to observe to date largely reflect long-term trends in Australian political campaigning via Twitter. Candidates fielded by the Australian Labor Party have been more active in posting tweets by a very large margin: ALP accounts posted about twice as many tweets as Liberal and National Party accounts put together.

A substantial number of their posts were retweets, too: some 47% of their tweets were retweets, compared to under 44% and under 38% for Liberal and National accounts, respectively. So far this is a significantly greater percentage than in 2013, when about 38% of ALP and only 25% of Coalition tweets were retweets. While this indicates a more coordinated social media campaign on both sides of politics, and reflects perhaps also a tighter political situation where getting one’s message out through all channels is crucial, the relatively limited level of activity from Coalition accounts also points at a continuing ‘small target’ strategy that may not be all too well suited to 2016’s much tighter electoral race.

image

The @mentions of candidates’ accounts, on the other hand, show a very substantial departure from, and reversal of, the 2013 picture. Coalition accounts are @mentioned and retweeted more often than ALP accounts by a factor of nearly two to one, while in 2013 ALP accounts led the Coalition by a ratio of only just over four to three. This could be read as an indication that the 2016 election is widely seen as the Coalition’s to lose: its outcome will largely be a verdict on the Abbott/Turnbull era, rather than a reflection on the performance of Bill Shorten’s opposition team – much as 2013 was arguably a Labor defeat more than a Coalition win.

However, also notable in this context is the comparatively substantial volume of retweets received by Labor accounts. At more than 17,000 since 25 May, ALP accounts have already received more than twice the number of retweets they gained in the entire 2013 campaign, while the Coalition’s 6,200 retweets to date still rank below its 2013 mark of 6,700 retweets. While in 2013, less than 3% of all tweets directed at ALP and Coalition were retweets, in 2016 more than 14% of all tweets mentioning ALP candidates are retweets.

Even if retweets do not always represent endorsements, it is clear from this pattern that in the Australian Twittersphere there is a much greater degree of engagement with, and even support for the tweets of the opposition party this year than there was for the opposition at the previous election.

Themes of Debate

It’s still too early for a detailed discussion of the major themes of the social media discussion around the candidates – we’ll need to do some more in-depth processing of the data to identify and group the relevant keywords and capture some of the unexpected themes that may arise from time to time. However, using a set of predesigned keyword collections relating to some of the defining topics in longer-term Australian political debate, we can at least begin to sketch out the themes that emerge as prominent so far.

This accounts for only one fifth of all the tweets posted by and directed at the candidates, because many such tweets do not contain any major keywords: they are posted in context, and may express agreement or disagreement with a previous statement without repeating the key points.

image

Amongst those tweets that can be clearly associated with specific topics, just over one quarter focus on the environment. This is unsurprising given the recent coverage of a significant coral bleaching event on the Great Barrier Reef, news reports about the Turnbull government’s intervention to redact warnings about the state of the reef from an UN report, and the ongoing controversy about devastating cuts to the CSIRO climate research teams.

Social policy – which covers topics such as health and education funding, the future of Medicare, and the implementation of the Gonski reforms, as well as the paid parental leave and national disability insurance schemes – runs a close second, at just under one quarter of al tweets with identifiable themes.

At some distance from these leading themes are discussions about the budget deficit and potential measures to address it, at less than 15% of all identifiably themes tweets; this theme also includes discussions about superannuation and the GST rate. At under 13%, the state of the National Broadband Network and Australian broadband policy more generally follows closely behind; this is unsurprising given Malcolm Turnbull’s close involvement with the NBN in recent years, and Labor’s perception that this represents one of its most popular initiatives.

Refugee policy appears yet further down the list, with less than 10% of all themed tweets. Notably, although this issue was thematised more strongly during the early days of our dataset, it has been pushed to the background more and more by other topics. This may indicate that Labor has – for the moment – succeeded in neutralising this issue, which is seen as one of its most crucial weaknesses. Discussion about threats from ISIS and other Islamist terror groups, finally, account for only 3% of all themed tweets. If the Coalition had hoped to highlight this issue as one of its areas of strength, then at least on Twitter it has failed to do so.

How the balance between these themes, with their respective opportunities and threats for the different parties, continues to shift during the remainder of the campaign may well provide us with an indication of the likely electoral perspectives for both camps, so we’ll continue to watch these trends closely over the coming weeks.

Postscript: The Political Reaction to the Orlando Attack

I write this in the immediate aftermath of the horrific attack by a single terrorist on an Orlando nightclub, which killed some 50 people. As civic and political leaders from around the world have reacted to this tragedy, so have Australia’s politicians – and their statements, and the social media response to these statements, are also evident in our data for the past day. While Australian electioneering and politicking must fade to insignificance in the face of a crime as devastating as this, I present some immediate observations about the Australian response here for the record.

From what we know so far, the nightclub targetted in Orlando was especially popular with the gay and lesbian community, and it therefore appears that this terrorist attack may also be understood as a hate crime. This has been a focus of many of the political statements made on Monday, and of the social media responses to these statements. On Monday, nearly 60% of all the tweets directed at political candidates that could be allocated to a given theme addressed LGBTQI matters, and especially same-sex marriage; in the period from 25 May to 12 June, meanwhile, only 3% of all tweets had done so.

The vast majority of these @mentions were directed at Prime Minister Malcolm Turnbull. Of the more than 24,000 @mentions and retweets of candidate accounts made this Monday, Turnbull received almost exactly half; of these, in turn, a significant majority discuss LGBTQI rights and same-sex marriage.

If he does monitor his Twitter account himself, Turnbull will be very well aware of the fact that nearly 7,000 of the @mentions he received on Monday were as a result of the widespread retweeting of four tweets by singer Troye Sivan, who linked Turnbull’s statement of support for the Orlando victims with Australia’s continued stance against same-sex marriage. Each had received more than 1,800 retweets by midnight on Monday, with the following generating the most resonance:

A statement by Opposition Leader Bill Shorten, by contrast, had received fewer than 250 retweets to date and has not attracted similar controversy:

Clearly this difference in responses is related to the distinctions between the Coalition’s and Labor’s stance towards same-sex marriage – and while this should not be the primary concern right now, the Orlando attack has the potential to restart the public debate in Australia about LGBTIQ rights. It is likely that Turnbull will continue to be pressed on the discrepancies between his personal support for marriage equality and his party’s more complicated position, which promises a referendum some time after the election. Labor, by contrast, may see this as an issue where its policy is more closely aligned with overall public sentiment – yet over the coming weeks, it must also avoid the perception that it is exploiting an unprecedented tragedy for political gain.

It is also unclear how much the sentiment expressed on Twitter about Turnbull’s statement reflects the wider public mood. Political analysts can be quick to declare unexpected events to be ‘gamechangers’ in an ongoing election campaign, but to do so in this case is inappropriate both because of this uncertainty, and – more importantly – because the horrific nature of the attack should give us pause for reflection before we return to the base political calculus of the current campaign.

ATNIX: Australian Twitter News Index, April 2016

Even before Prime Minister Malcolm Turnbull fired the starting gun on this year’s election campaign last weekend, Australian media were very clearly switching to election mode. Speculation about any last-minute budget sweeteners and debate about likely policy settings began to pick up, and commentary about the implications of a double dissolution election was already in full swing.

But was any of this reflected in the Australian news stories and opinion pieces that were widely shared on Twitter? Were Australian Twitter users as excited about the prospect of a two-month campaign as Malcolm Turnbull and Bill Shorten, or did they direct their attention elsewhere? The Australian Twitter News Index for April 2016 provides a picture of a public sphere in transition.

image

Indeed, the month was bookended by major stories. Most prominent overall, and responsible for the sharpest spike in news sharing, on 4 April, was the release of the Panama Papers, leaking detailed information about the politicians, public officials, managers, celebrities, and other plutocrats using the Panamanian law firm Mossack Fonseca to hide their wealth offshore, away from their local tax offices. The ABC News story about the Panama Papers became its most widely shared article for the entire month, featuring in more than 1,900 tweets (1,700 tweets of these on 4 April itself), with a special feature explaining the importance of the Panama Papers receiving another 1,100 tweets as well.

A second major story, whose impacts will certainly stretch into May and beyond, is the PNG Supreme Court’s ruling that the detention of Australian asylum seekers on Manus Island is illegal. First posted on 26 April, the ABC News article about this ruling received some 1,700 shares on Twitter. Indeed, in what may be an ominous sign for the federal election, an unrelated ABC News story about refugee policy, reporting Immigration Minister Peter Dutton’s decision to send 90 refugee children from Australia back to Nauru, was shared in some 1,100 tweets since 4 April – this made it the fourth most shared ABC News story for the month.

Finally, it is perhaps no surprise that the extraordinary footage of Greens MP Jeremy Buckingham setting fire to the Condamine River should also receive substantial attention from Twitter users: the ABC News article containing the video was shared in nearly 1,700 tweets since appearing on 23 April, and this may well point to environmental policy again featuring strongly in the election campaign.

Our focus here is on the major ABC News stories especially because in April the site remained the most widely shared Australian news site on Twitter, while closest competitor Sydney Morning Herald continued to lag behind by some distance. Weekday averages for ABC News appear to have settled around 10,000 tweets, while only about 6,000 tweets per weekday share links to the Sydney Morning Herald; this is a notable drop-off from earlier times, when ABC and SMH often ran neck-and-neck.

The Conversation, meanwhile, is now comfortably established as the third most widely shared Australian-based news and opinion site on Twitter, though its numbers are certainly boosted by its disproportionately international contributor and reader base; if we took into account only the tweets by Australian users that contained links to The Conversation, it would most likely rank significantly lower than it does here.

Its top stories during April 2016, incidentally, represent a much broader spread of topics than those of ABC News, and few stories stand out particularly strongly: a factcheck on the safety impact of better pay for truck drivers received 850 tweets; an article about the black market in academic papers 580 tweets; a piece reviewing the benefits of EU membership for the UK 490 tweets; a warning by David Attenborough about the state of the Great Barrier Reef 410 tweets; and a piece about ancient Aboriginal star maps 370 tweets.

Meanwhile, our Hitwise data on the news and opinion sites most visited by Australian Internet users paints a rather different picture of the news market, as usual. Here, news.com.au continues to rule, and the Sydney Morning Herald maintains a strong second place, even though its ranking is increasingly under attack from Nine News, following that site’s demerger from nineMSN.

image

Indeed, Nine News is visited especially frequently during 12 and 13 April, but for all the wrong reasons: the majority of the attention during these days is almost certain to have been generated by the case of its 60 Minutes team being detained for their involvement in an alleged child abduction attempt in Beirut (with a smaller spike on 20 April as some of the team are released and begin their journey back to Australia).

Away from such isolated events, the data on total site visits in Australia provide a useful indication of the mainstream news sites that Australian political campaigners are likely to target with their major announcements over the next two months. Our ATNIX data, meanwhile, will show which of the articles that result from this campaigning received the greatest traction on Twitter – not a representative space that reflects overall political opinion in Australia, certainly, but one that tends to attract some disproportionately vocal and influential demographics in society.

Bring it on, as they say.

Standard background information: ATNIX is based on tracking all tweets which contain links pointing to the URLs of a large selection of leading Australian news and opinion sites (even if those links have been shortened at some point). Datasets for those sites which cover more than just news and opinion (abc.net.au, sbs.com.au, ninemsn.com.au) are filtered to exclude the non-news sections of those sites (e.g. abc.net.au/tv, catchup.ninemsn.com.au). Data on Australian Internet users’ news browsing patterns are provided courtesy of Hitwise, a division of Connexity. This research is supported by the ARC Future Fellowship project “Understanding Intermedia Information Flows in the Australian Online Public Sphere”.

#ausvotes Revisited: Social Media in the 2013 Australian Federal Election

As Australia commences one of the longest federal election campaigns in living memory, much attention will be paid again to how parties and politicians are utilising the latest tools available in their campaigning arsenal: social media. We’ve seen Facebook and Twitter used as emerging campaigning tools in the 2010 and 2013 elections already, and even in 2007 some parties were experimenting with platforms such as YouTube already, with decidedly mixed results. In 2016, we should expect the mainstream social media platforms to be fully integrated into overall campaigning strategies.

To predict how the major parties might use social media to promote their candidates in 2016, a look back at the 2013 election is instructive. At the time, my colleagues and I in the QUT Digital Media Research Centre tracked the Twitter accounts of all federal members and candidates, capturing both their own tweets and the tweets directed at them (as @mentions or retweets) – and our analysis reveals some clearly diverging patterns across the different party groupings. In total, we tracked some 117 ALP accounts, 100 Coalition accounts, 68 Greens accounts, and 112 independent and minor party accounts  over the course of the campaign.

During the campaign period from 5 August to 7 September 2013, ALP candidates out-tweeted their competitors by a substantial margin. They posted more than twice as many tweets as Coalition candidates, in spite of their broadly comparable number of accounts. The Greens, by contrast, were considerably more active on Twitter – outdoing even the Coalition, although they fielded only two thirds as many tweeting candidates.

image

Even more notable, however, is the composition of the leading group of tweeting candidates for each party group. In the Coalition, active tweeting was a task reserved largely for senior members of Tony Abbott’s frontbench team: almost all of the top ten Coalition tweeters would go on to join the Abbott ministry. On the ALP side, only Anthony Albanese and Mike Kelly were current members of the Rudd cabinet, and Craig Emerson had been a minister under Gillard (and was not recontesting his seat at the election). The Greens tweeting effort, finally, was concentrated much more centrally around leader Christine Milne, who averaged a remarkable 35 tweets per day during the election.

By contrast, Kevin Rudd and Tony Abbott did not feature as particularly active Twitter users during the campaign – which seems out of character in the case of Rudd, who had established a significant social media presence and remains the Australian politician with the largest number of Twitter followers to this date. Both leaders posted fewer than three tweets per day, on average.

These patterns point to strongly divergent social media campaigning strategies for the three party blocs. For the Coalition, they may be read as an attempt to control the party message by centring election-related tweeting activity on the inner circle of leading frontbenchers. Whether these politicians posted their own tweets or had campaign staff do so on their behalf, it can be expected that such senior party leaders would take relatively few significant missteps during the campaign, compared to less experienced rank-and-file candidates.

The centralisation is in line with the Coalition’s overall ‘small target’ strategy, in essence drawing supporters’ as well as critics’ attention to these senior leaders as what might be described as known targets, while diverting the spotlight from less proven campaigners. To a lesser extent, the same may be true for the Greens candidates – although here the picture is somewhat more mixed, and Senator Milne clearly serves as the most active (and thus, visible) face of the party’s campaign.

For the ALP, two explanations appear most likely, and are not mutually exclusive. First, after the bitter internal struggles within the party in the years leading up to the 2013 election, and in the face of a seemingly assured election loss, it seems possible that a number of senior frontbenchers did not feel motivated to campaign to their full capacity, on Twitter or in other media. Second, this left space for experimentation with social media campaigning by relatively less prominent local candidates, who – in the absence of coordinated action by the party itself – may also have felt especially motivated to devise their own strategies for using social media to at least limit the magnitude of the impending defeat.

Whether this strategy was pre-planned or not, Labor were in essence seeking to draw voters’ attention away from the parliamentary party’s problems, and towards the more immediate choice of the right local representative. Combined with offline engagement in the electorate, this approach – which we might describe as a local target strategy – was also an important factor in independent candidate Cathy McGowan’s victory against Coalition frontbencher Sophie Mirabella in the electorate of Indi, against an overall swing of the national vote towards the Coalition.

But do such strategies deliver any measurable outcomes, in terms of engagement from the electorate? If we consider visible engagement on Twitter alone, the picture is mixed. ALP and Coalition candidates did capture a vast majority of all candidate mentions on Twitter during the campaign, with the ALP in a significant lead over its opponents, but only a very small fraction of those mentions – in both cases, less than 3% – came in the form of retweets (and could therefore be seen as supporting a candidate and disseminating their messages).

image

Further, Twitter users’ attention is squarely on the Prime Ministerial candidates Kevin Rudd and Tony Abbott, both of whom account for more than 50% of all the mentions received by their respective parties’ candidate accounts. This focus by Twitter users on the leaders of the major parties mirrors a similar distribution of attention in the mainstream media, and can be seen as reflecting a quasi-presidential election mode even in spite of Australia’s parliamentary system.

Members of the senior leadership team for each party are also well-represented amongst the most mentioned accounts, but attract much lower numbers. On the ALP side, several accounts from outside the frontbench are also present here: Julia Gillard is the fourth most mentioned Labor politician, and former Deputy PM Wayne Swan also features. Such prominent positions for former leaders do not necessarily indicate support or endorsement by ordinary Twitter users – but they do point to public discussions, during the election campaign, of the internal struggles played out inside the parliamentary Labor party over the past two legislative periods. This would not have helped Labor’s attempts to get its message across.

Overall, then, whatever each party’s social media strategy, ordinary Australian Twitter users appeared much more prepared to talk about, and at, the candidates’ accounts during the 2013 election than to retweet the candidates’ political messages to their own networks. Their focus of discussion was overwhelmingly on the two contenders for the Prime Ministership, and this is perhaps unsurprising at the end of an electoral cycle that was thoroughly dominated by discussions about leadership; this focus, on Twitter as well as elsewhere in the media, may well indicate a temporary or permanent shift towards a more presidential style of politics in Australia.

But such reluctance to retweet should not be seen as a sign that campaign messages on social media are necessarily falling on deaf ears – the candidates’ tweets may well have been read (and even responded to), even if retweets rarely eventuated. Away from the focus on the Prime Ministerial candidates, Labor candidates’ locally targetted activities, online as well as offline, may have reduced the size of the defeat in a number of electorates (the ALP’s own campaign review notes that “local campaigns and great candidates made a huge difference”). Similarly, the Coalition’s focus on featuring a united leadership team clearly distinguished it from the bitter internal battles within the ALP.

With yet another replacement of a first-term Prime Minister by his own partyroom in the 2013-16 term – this time on the Coalition side –, and a comparatively united front presented by the new Labor leadership, it will be interesting to see whether patterns of activity on Twitter in the 2016 campaign mirror those of the 2013 election, with roles reversed between the major parties. We’ll again track the election on Twitter during the 2016 campaign – and I hope to provide some glimpses of the patterns emerging from this here over the next two months.

Twitter Analytics Using TCAT and Tableau, via Gawk and BigQuery

I’ve previously introduced my TCAT-Process package of helper scripts (written in Gawk), which take exports of Twitter data from the Twitter Capture and Analysis Toolkit (TCAT), developed by the Digital Methods Initiative at the University of Amsterdam, and convert them to a format that is best suited to using the data in the analytics software Tableau. This post is an update that provides the latest version of TCAT-Process, and outlines some of the alternative options that are now available through further developments in TCAT itself.

But beyond these updates, the major new addition to this setup that I’ll describe here is a process for uploading the data to Google BigQuery. BigQuery is a commercial but very affordable platform for working quickly with large datasets, and uploading the processed Twitter data to BigQuery can considerably speed up the analytics process – especially also because Tableau has the ability to connect natively to BigQuery databases. For large Twitter datasets – and when you’re dealing with major global events, they can easily grow to the millions of tweets and generate gigabytes of data –, this is a crucial advance which outsources a lot of the computationally intensive processing to Google’s servers, rather than doing it locally on a desktop machine.

None of this is entirely easy – partly also because recent changes to TCAT, although welcome where they’ve added new functionality, have at times also changed the underlying data formats. But hopefully the following outline of steps will help you get your data from TCAT into Tableau without too many problems.

Please note: if your version of TCAT has options to export hashtag and mention tables, if your dataset is small enough for these exports to work reliably, and if you’re not interested in resolving the URLs contained in your data, you won’t need to use TCAT-Process at all. In that case, skip the section below that discusses TCAT-Process, and load your TCAT exports directly into BigQuery, following the steps described below.

Downloading TCAT Data

The first step in the process is necessarily to export the data from TCAT. Recent versions of TCAT have added an export option in tab-separated format (as opposed to comma-separated), and this is by far the preferred format for our further work.

TCAT-Process is able to work with CSV files exported from TCAT, too, but if at all possible, choose TSV:

image

Then, select the desired export parameters (dataset, timeframe, etc.), and export all tweets from your selection:

image

If your version of TCAT is recent enough, you’ll also have options to export hashtag and mentions tables. Depending on your server setup, these may not work very well for very large datasets (of a million tweets or more), and TCAT will time out or produce empty files if you try them – so export hashtags and mentions if you can, but if this doesn’t work we’ll use TCAT-Process to create them in a later step.

image

Installing and Using TCAT-Process on the TCAT Data

(As noted, skip this section if you’ve managed to export the full, hashtag, and mentions tables from TCAT and are not interested in resolving the URLs in your data.)

First, download the latest version of TCAT-Process from here: tcat-process.zip. This contains a directory named _scripts that should be placed in your central Twitter data folder, alongside the folders that your various datasets are stored in.

If necessary, you also need to install Gawk and cURL, the tools which TCAT-Process relies on – see my previous post for more information on how to install these.

I’ve already outlined the inner workings of TCAT-Process in my previous post, and won’t repeat all of this here. However, there are a number of key additions to the processing options that are worth pointing out. Here is the full set of option switches that TCAT-Process now uses:

  • mac: file paths and other aspects work slightly different on Macs, compared to PCs. Set mac=1 on a Mac, otherwise ignore.
  • path: by default, TCAT-Process expects its helper scripts to be located in a _scripts folder that sits next to the current working directory in the next higher folder (addressed as ../_scripts/); if your scripts are located elsewhere, specify the path here. Make sure you include the trailing slash. On a PC, escape backslashes by adding a second backslash, e.g. path=D:\\Twitter\\_scripts\\.
  • file: the name of your full export file. Set file=[filename.ext], e.g. file=Eurovision_2016-20160108-20160509——–fullExport–6fa087d64b.tsv.
  • tcattype: the export format of your TCAT file. Set to either tcattype=csv or tcattype=tsv; defaults to csv.
  • nopreprocess: if for some reason you’ve already preprocessed your export file, or if you’re working with Twitter data from a source other than TCAT, set preprocess=1; otherwise ignore. If you do set preprocess=1, TCAT-Process expects an additional file named [filename]-tweetexts.csv/tsv in its working directory, which contains a list of all tweets in the format id,text.
  • nohashtypes: if you’ve successfully exported the hashtag and mention tables, you can keep TCAT-Process from extracting similar data from the full dataset. Set nohashtypes=1 in that case; otherwise ignore.
  • nourls: by default, TCAT-Process will resolve all URLs in the dataset. This can be very time-consuming; set nourls=1 to skip this step, or otherwise ignore.

TCAT-Process will work best if you call the script from within the folder that contains your dataset. So, once you have downloaded your full dataset as filename.tsv, open a terminal window and make the dataset folder your current directory. To process the data file completely using TCAT-Process, use the following command:

gawk -f ..\_scripts\tcat-process.awk file=filename.tsv tcattype=tsv

If you’ve successfully downloaded the hashtag and mention tables that TCAT generates, you can keep TCAT-Process from generating those tables again from the main dataset:

gawk -f ..\_scripts\tcat-process.awk file=filename.tsv tcattype=tsv nohashtypes=1

(In each case, use ../_scripts/tcat-process.awk if you’re on a Mac. I’m assuming here that the _scripts folder sits within the directory that also contains the folder with your dataset.)

Press return when prompted, and wait until TCAT-Process completes. This may take some time depending on the size of your dataset – for datasets of more than 100MB, it could stretch to hours or days. URL processing takes up the vast majority of this time, so use nourls=1 if you’re happy to skip that part. Also, while the URLs are still processing you can already get started on uploading the full, hashtags, and mentions datasets to BigQuery.

Uploading Your Data to BigQuery

First, follow the instructions provided by Google to set up a BigQuery account. Note that BigQuery isn’t free – for very extensive datasets, you will eventually generate costs that would be charged to your credit card. That said, for the volume of Twitter data most of us will be working with, those costs are largely negligible, and will remain at a level of cents rather than dollars. See the pricing information provided by Google for more details, and use the History tab on the Billing page of the Google Cloud Platform to keep track of your current costs.

Once you are set up for Google BigQuery, we’ll first need to create a new project to hold your data. Go to the Google Cloud Console, and from the pull-down menu in the header select the Create a project… option. In the dialogue that pops up, choose a meaningful name for your project:

image

Next, use the Dashboard option to create a Cloud Storage bucket. A ‘bucket’ is a container for your uploaded data files. Give this a meaningful name, e.g. tcat_exports:

image

You should now see an empty file list for your new bucket:

image

To upload your data files to the Cloud Storage bucket, simply drag them onto the file list in your browser, and an upload progress indicator will appear. For each dataset, you should have up to four files to upload: your full data export from TCAT (filename …fullExport….tsv), the mentions and hashtag tables from TCAT if you have them (filenames …mentionExport….tsv and …hashtagExport….tsv), and/or the mentions, hashtags, and URL files you’ve created using TCAT-Process (filenames …-tweettypes.tsv, …-hashtags.tsv, and …-urlpaths.tsv). There is no need to upload any of the other files that TCAT-Process has created (and in fact you’re welcome to delete these at this point). Depending on the size of your datasets, and on the quality of your network connection, the upload may take some time – keep your browser window open while it progresses:

image

The uploaded files will appear in the bucket browser – and once they’re all there, we’re ready to import them into BigQuery. Use the Google Cloud Platform menu sidebar to go to Google BigQuery (the menu has many options, so you may want to search for ‘bigquery’):

image

The Twitter data project you’ve created should already be preselected. In the left sidebar, click on the pull-down arrow next to your project title, and create a new dataset. Give this a meaningful name that describes the contents of your data (for my example below, I’ll be using ‘eurovision’, since that’s what my TCAT dataset is about):

image

When the dataset appears under your project, mouse over it and click the + icon that appears to create a new data table:

image

In the Create Table dialogue that now appears, choose the following settings (start with the full export file, and repeat this for each subsequent file):

  • Location: choose Google Cloud Storage, and enter the name of your data bucket and the name of the uploaded file, as in the example below (I have named my storage bucket tcat_exports).
  • File format: select CSV (we’re usually working with TSVs, of course, but BigQuery doesn’t distinguish between the two).
  • Table name: stick with the preselected dataset name (in the example below that’s eurovision), and enter an appropriate name for the new table (e.g. fullexport, hashtagexport, mentionexport, tweettypes, hashtags, urlpaths). Note that you can only use letters, numbers, and underscores in table names.

image

Next, we need to define an import schema for the new table. This schema describes the table you’re importing, and is therefore different for each table type. I’ve created a number of presets that describe each type – download and unpack the following file: bq-import-schemas.zip. Use a text editor to open the file that describes the table you’re importing:

  • TCAT full export: TCAT BQ import schema (TCAT full export).txt
  • TCAT hashtags export: TCAT BQ import schema (TCAT hashtags table).txt
  • TCAT mentions export: TCAT BQ import schema (TCAT mentions table).txt
  • TCAT-Process hashtags file: TCAT BQ import schema (tcat-process hashtags table).txt
  • TCAT-Process tweettypes file: TCAT BQ import schema (tcat-process tweettypes table).txt
  • TCAT-Process urlpaths file: TCAT BQ import schema (tcat-process urlpaths table).txt

Select the entire schema as shown in your text editor, and copy it to your clipboard. Back in BigQuery, below the Schema settings, click on Edit as Text and paste the schema into the textbox that appears:

image

Finally, in the Options settings choose Comma or Tab depending on the format of your datafiles, set Header rows to skip to 1, and tick Allow quoted newlines and Allow jagged rows:

image

When you’re all set, click Create Table and wait until the process completes. BigQuery will automatically switch to the Job History list, which shows the progress of your current data import job; click on the job to see more details. Once the job is complete, the icon to the left of the job will turn green.

image

If it turns red to indicate an error, check for what went wrong and click Repeat Load Job. In case there are any problems with your data files, you might want to adjust the Number of errors allowed setting in Options (say to a value of 10), or tick Ignore unknown values. (Such errors may be caused by particularly unusual characters in tweet texts: I’ve noticed that in its current version, the character combination \” is incorrectly encoded by TCAT as it exports the data, and confuses BigQuery as it parses the source file. But these errors should be very rare.)

If there is a persistent problem with importing your full export file from TCAT, you may be running an older version of TCAT which exports a different number of data fields, in a different order. In that case, try the import schema in TCAT BQ import schema (TCAT full export, 35 fields).txt, rather than the schema in TCAT BQ import schema (TCAT full export).txt. (To check which version you are running, export a small dataset from TCAT and open the export file in Excel or a text editor. The older TCAT version will export 35 fields, the later version exports 36 fields. (There is also a much older version which exported only 22 fields, but hopefully most people will have moved on from this by now.)

Repeat these import steps – with the appropriate import schema in each case – for each of your data files, so that in the end you have up to four BigQuery tables (e.g. fullexport, tweettypes, hashtags, urlpaths – or, if you’re using the original TCAT exports of mentions and hashtags, fullexport, mentionexport, hashtagexport, urlpaths).

image

Note that if your source data are split across multiple data files – for instance because you’ve exported your dataset from TCAT every week or every month – you can also import multiple data files of the same type into the same table: the new data will simply be appended to the table, and the order in which we import the data into the table doesn’t matter because we’re accessing the content through Tableau anyway. So, for instance, if you have TCAT …fullExport… files for April, May, and June, use the approach described above for each of these files, but direct them all to a single fullexport table. Then, load the corresponding tweettypes files for the April, May, and June exports all into the same tweettypes table on BigQuery – and do the same for hashtags and urlpaths. You could also repeat this process for every future month, and so gradually add new data to your dataset as you continue your data-gathering activities.

At the conclusion of this process, all of our data are now in BigQuery and ready for use – which means that it’s time to switch to Tableau and connect to our data from there. Alternatively, of course, you could also query your datasets by using BigQuery’s own SQL query tools, or any other software that connects to BigQuery

Accessing the Data through Tableau

Connecting to the data in Tableau is now very straightforward. Open Tableau, and select Google BigQuery from the Connect menu:

image

Now select your Project and Dataset – in my example, that’s TCAT Data and eurovision:

image

Drag the table that contains your full export data onto the Drag tables here canvas first – I’ve named it fullexport:

image

Now drop your other tables onto the same canvas. If you’ve processed everything using TCAT-Process, the results should look like this, and Tableau will already have guessed how you want to link these tables (it’s not quite correct in its guess, but we’ll address this in a second step):

image

For each of the linked tables, click on the overlapping circles and choose Left Join rather than Inner Join:

image

The end result should look as follows (though of course you may have chosen different table names, and there may not be a urlpaths table if you’ve chosen not to resolve URLs):

image

Alternatively, if you’re using the hashtagexport and mentionsexport tables from TCAT itself, Tableau will want you to select how these should be linked. Choose a Left Join, and link the tables on Id = Tweet Id in each case:

image

Then add the urlpaths table (if you’ve resolved the URLs), and make sure it’s connected with the full export table as a Left Join as well. The end result should look like this:

image

If you’re familiar with using Tableau to analyse the data in offline CSV and TSV files, you may be tempted to also create a data extract at this stage. This is not necessary when we’re working with BigQuery, because all of the data processing happens on Google’s servers. Creating an extract on the client side would in fact slow down your data processing considerably, especially when working with very large datasets – so stick with a Live connection:

image

When you’ve completed this setup, click Sheet 1 to go to a blank worksheet:

image

You’re now almost ready to analyse your data as you see fit. Two more setup steps will be useful, though: first, in analysing tweet volumes you’ll usually want to count the number of distinct tweet IDs, rather than simply the number of records in your dataset, as this provides the most accurate count. So, in the sidebar on the left, drag Id from Dimensions to Measures, where it will automatically be set to use Count (Distinct):

image

(To trigger this behaviour, our BigQuery import schema declared Id to be a string rather than a number, as you may have noticed earlier. While in principle, tweet IDs are numbers, of course, in our analysis we’ll never actually use them as such – what would be the point of calculating the sum or average of a bunch of IDs, after all?)

Second, the Time field contains the timestamp for each tweet, but is set to UTC by default (it’s calculated automatically by BigQuery from a numerical Unix timestamp). To adjust this to the local time most appropriate for your further analysis, create a calculated field that adds or subtracts a number of hours from Time. Hover your mouse pointer over the Time field, click the down arrow that appears, and select Create > Calculated Field…:

image

Give the field a name (for instance the code for the timezone you’re shifting to), and enter the following formula:

DATEADD(‘hour’,10,[Time])

In my example, to shift UTC to Australian Eastern Standard Time (AEST, or UTC+10), this is the formula to use:

image

Click OK, and at the bottom of the Dimensions sidebar you should now find a new field with the name you’ve given it (e.g. AEST). Use this rather than Time itself for any further time-based analyses.

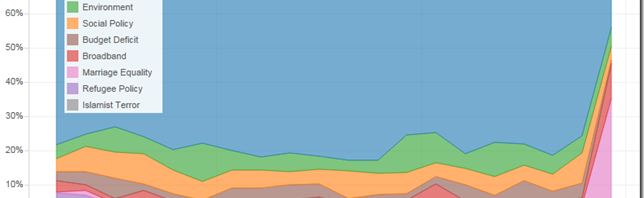
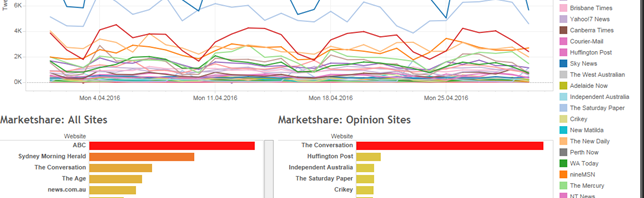
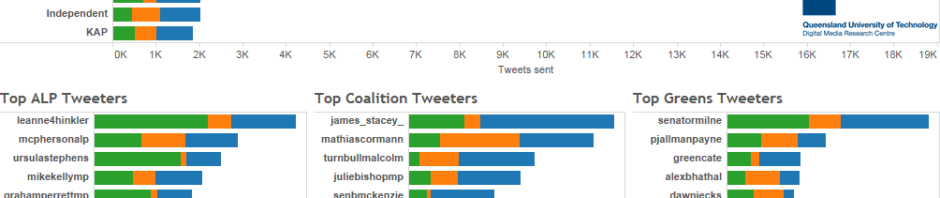
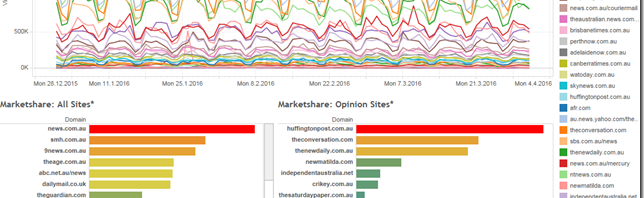
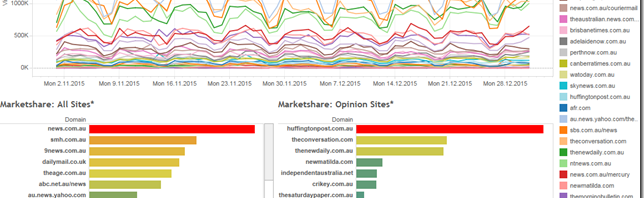
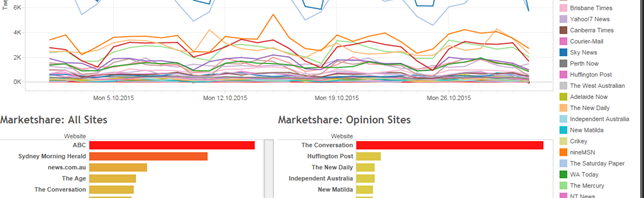
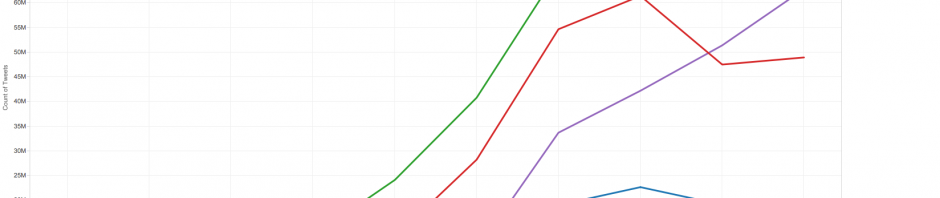
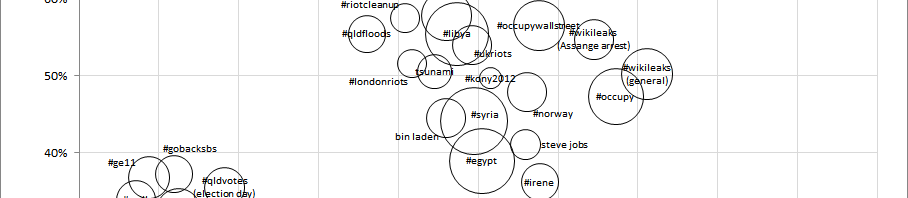
And with this final step, you’re ready to analyse your data, and benefit from the vastly improved analysis speeds that Google BigQuery offers, especially when you’re dealing with very large datasets. Some ideas for the range of analytical approaches you might want to pursue are outlined in my previous posts on using Tableau to analyse TCAT data – so perhaps start here or here?

ATNIX: Australian Twitter News Index, January-March 2016

In spite of my best intentions, I’m afraid the Australian Twitter News Index continues to be a somewhat irregular affair for the moment, and so this latest update once again covers a number of months: in this case, it’s reporting on news sharing patterns in Australia for the first quarter of 2016. We begin, therefore, with some of the overall trends in the data. Most notable, perhaps, is that The Conversation has advanced to become Australia’s third most widely shared news and opinion site: the more than 260,000 tweets linking to its content during January to March 2016 bested even the performance of such established mainstream news sites as news.com.au, The Age, and The Australian.

It is important to remember here, though, that this figure captures the global volume of tweets linking to each site: The Conversation’s continuing expansion into new territories (now including the UK, US, France, and southern Africa) no doubt accounted for a substantial portion of all tweets linking to the site, and – following ABC News and the Sydney Morning Herald – it is now well on its way to becoming a globally recognised news and opinion site. By comparison, we may also assume that those sites it has leapfrogged since our December update (when it was ranked sixth) continue to be popular mostly with a domestic audience, and largely fail to make much of an international impact.

image

While there is not enough space to cover all the specific news events contained in the present dataset, a handful of other observations are also worth making. First, somewhat hidden in the data is a spike in link sharing activity for a number of sites around Australia Day – and as we will see from our Hitwise data below, this translates into a substantial increase in site visitors especially for commentary site New Matilda: its article on that day’s Google doodle – a stunning artwork commemorating the Stolen Generations – accounts for some three quarters of the 2,000 tweets linking to New Matilda that day, and drives the number of total visits to the site to more than 500,000, when on normal days it struggles to break 50,000. Not all of the link sharing spikes on Australia Day are related to that story, however: the most widely shared piece on Nine News, by contrast, is about a US dog “accidentally” running a half-marathon, and also gains some 2,000 tweets.

Later in the quarter, SBS (and its subsidiary channel, National Indigenous Television) generate substantial impact, by comparison with their average level of visibility on Twitter, with a collection of articles addressing International Women’s Day. In total, its series of articles highlighting a range of inspiring women – including especially also indigenous Australian leaders – as well as addressing continuing sexism and injustice towards women more than doubles the number of tweets linking to SBS content, to nearly 3,400 tweets on 6 March 2016.

Meanwhile, the most shared articles on the leading news sites paint a widely divergent picture of day-to-day politics. On ABC News, they reflect a strong focus on the environment: a 28 March story on the large-scale coral bleaching in the Great Barrier Reef received some 2,100 tweets, while a report on 31 January on the devastating impact of Tasmania’s summer fires gains 1,500 shares, and an article on 21 January about the International Whaling Commission’s highly critical report on Japan’s continued illegal whaling programme receives nearly 1,400 tweets.

At the Sydney Morning Herald, several issues vie for attention. Leading the back is the paper’s 23 March report that the New South Wales Liberal Party ‘concealed’ illegal donations before the 2011 state election, attracting some 2,500 shares; but a 26 March article on “why Finland has the best schools” is also in the running, with 1,800 tweets linking to it (including quite possibly some Finnish Twitter users). In third place, finally, is the SMH’s 18 January coverage of an Oxfam report on the growing global inequality between rich and poor; it received some 1,600 tweets.

As always, our Hitwise data on the total number of visits by Australian Internet users to each of the news and opinion sites we track paint a somewhat different picture, both in total numbers and in the distribution of attention. To begin with, here The Conversation is not ranked quite so highly, since the Hitwise figures do not include international visitors to the site; nonetheless, The Conversation ranks a strong second in the opinion category in Australia, following the Huffington Post’s Australian operation. HuffPo Australia, by contrast, is further ahead of competition such as The New Daily than its link-sharing performance on Twitter would lead us to believe: New Daily readers seem more willing to promote its content in their tweets at this stage.

image

The overall ranking of the mainstream news sites in Australia has remained largely stable, and a notable gap in the number of total visits has developed between the top six sites and the remainder of all Australian news and opinion sites. Amongst that group, the Australian operation of the UK’s Daily Mail has dropped back again behind The Age and ABC News, following its excursion to fourth place during the November/December 2015 period; perhaps the particularly Australian focus of the news during the summer period (including the coverage around Australia Day and its various ceremonies and debates) has contributed to this renewed focus on more home-grown sites.

Also clearly visible in the Hitwise data is the substantial spike for New Matilda on Australia Day that we have already discussed above. Here, we see a clear demonstration of a site advancing – suddenly and briefly – well above its long-term baseline, but it is also notable that this does not have any lasting effect on New Matilda’s overall visitor numbers. It is quite possible, incidentally, that this increase was driven at least in part by Google itself: Google will often link to further information about the stories behind its doodles, and New Matilda’s story about it may well have been picked up as an article to link to, creating a feedback loop of attention.

What is striking about the key themes during the first quarter of 2016, then, is especially their focus on fundamental long-term topics, from the environment to reconciliation. As we return to the day-to-day politicking of a federal election year, we’re likely to see this replaced again by a considerably more narrow focus on short-term issues.

Standard background information: ATNIX is based on tracking all tweets which contain links pointing to the URLs of a large selection of leading Australian news and opinion sites (even if those links have been shortened at some point). Datasets for those sites which cover more than just news and opinion (abc.net.au, sbs.com.au, ninemsn.com.au) are filtered to exclude the non-news sections of those sites (e.g. abc.net.au/tv, catchup.ninemsn.com.au). Data on Australian Internet users’ news browsing patterns are provided courtesy of Hitwise, a division of Connexity. This research is supported by the ARC Future Fellowship project “Understanding Intermedia Information Flows in the Australian Online Public Sphere”.

ATNIX: Australian Twitter News Index, November/December 2015

The Australian Twitter News Index for 2015 concludes with a double helping that covers both November and December – a time when the sharing of news stories on Twitter usually begins its slow decline towards the holiday season. These patterns are sustained in 2015 as well, although the drop-off in news engagement is more pronounced for some sites than for others: stories by Twitter market leaders ABC News and Sydney Morning Herald are shared considerably less in the weeks before and after Christmas, while third-placed source news.com.au experiences fairly little variation from week to week.

This is linked, most likely, to the range of stories commonly covered by these sites: while the politics and business updates that are the bread and butter of ABC News and SMH slow down over the holidays, entertainment and celebrity news still continue, and continue to draw readers willing to share these stories to news.com.au. ATNIX for January 2016, in turn, is likely to provide a mirror image: as politics and business resume and Twitter-based discussion is fanned by new events, so will major news stories on these topics be shared widely again.

Beyond these overall patterns, a number of key events stand out during these final months of 2015. Possibly the most widely reported of these events were the horrific terror attacks in Paris in the evening of 13 November, which resulted in a considerable number of casualties. Somewhat surprisingly, however, ATNIX for November shows only limited changes in the volume of news being shared on the relevant dates: there are moderate increases for the Sydney Morning Herald, The Australian, the Daily Telegraph, and Yahoo!7 News, but notably no impact at all on ABC News sharing levels.

Most likely, the timing of the event is responsible for this: occurring as they did in the early hours of the Australian Saturday morning, Australian media may have been insufficiently staffed to respond with in-depth coverage immediately, and instead domestic news users would have looked towards (and then shared) European and other international media for their live coverage of events. It is only the discussion of the attacks’ consequences, and their implications for domestic politics, which would have generated further news sharing for Australian sites.

image

Several news stories in the Australian online news media did receive widespread attention on Twitter during these final months of 2015, however. ABC News records a substantial spike in interest early on, on 5 November: its story about a Filipino TV show that broke the Twitter world record for the most tweets in one day was in turn itself shared in more than 6,000 tweets, no doubt also by members of the sizeable Twitter community in the Philippines.

news.com.au, meanwhile, attracts considerable interest for a period of several days in early December; this is especially remarkable as this attention is sustained over the weekend, when news sharing usually declines considerably. Sadly, though, this extra boost in activity was driven almost entirely by a collection of spam accounts which incessantly tweeted links to a variety of news.com.au articles, possibly to promote a new site collecting news links from a variety of sources. By now (just over a month later), many of these spam accounts have been shut down by Twitter – and the volume of tweets sharing links to news.com.au’s content is back to normal.

Our data from Hitwise, a division of Connexity, add some further detail on the news engagement patterns for these past two months. Absent completely from the Twitter data was any indication of heightened activity during Melbourne Cup Day, confirming the well-established trend that already widely covered media events do not usually receive a significant number of shares on Twitter; the Hitwise data on visits to Australian news Websites, on the other hand, do show that – even without being prompted to do so by news sharing on Twitter – the punters did flock to a range of news sites. Leading the pack, unsurprisingly, is Melbourne paper The Age, whose visit numbers rise by some 800,000 compared to ordinary weekdays, to just over 1.8 million.

The Paris attacks similarly do generate additional visits to Australian news sites, even if their content is not widely shared on Twitter. Here, the effect is to raise the number of visits to many sites on the Saturday and Sunday following the attacks to a level comparable with what we would normally observe only on a weekday: market leader news.com.au, for instance, served some 1.8 million visits on 14 and 15 November, when on the preceding and following weekends it struggled to reach 1.5 million visits per day. News readership on the Monday is similarly enlarged, spiking at almost 2.4 million for news.com.au.

image

Also notable by its absence is the pronounced decline of activity towards the holiday period. There is, if anything, a minor drop-off as the year runs out, and the slowdown over 26 and 27 December is perhaps a little more pronounced than on normal weekends, but even on Christmas day many Australian news sites receive a number of visits that is broadly comparable with other, workday Fridays. Considering the year we’ve had, perhaps Australian users no longer feel that they can easily switch off from following the news.

Standard background information: ATNIX is based on tracking all tweets which contain links pointing to the URLs of a large selection of leading Australian news and opinion sites (even if those links have been shortened at some point). Datasets for those sites which cover more than just news and opinion (abc.net.au, sbs.com.au, ninemsn.com.au) are filtered to exclude the non-news sections of those sites (e.g. abc.net.au/tv, catchup.ninemsn.com.au). Data on Australian Internet users’ news browsing patterns are provided courtesy of Hitwise, a division of Connexity. This research is supported by the ARC Future Fellowship project “Understanding Intermedia Information Flows in the Australian Online Public Sphere”.

ATNIX: Australian Twitter News Index, October 2015

After the political upheavals in September, which saw Australia’s fourth change of Prime Minister since 2010 with the return of Malcolm Turnbull as Liberal leader, it feels as if things have slowed down a little as the country settles gradually into the post-Abbott era. Certainly we’ve not seen any major new political controversies or scandals, and this is reflected in the activity patterns captured in the Australian Twitter News Index (ATNIX) for October.

There are very few departures from the long-term averages for this month: ABC News is in a stable position of leadership as the most widely shared Australian news site on Twitter, ahead of the Sydney Morning Herald in second place, and both are well ahead of the rest of the field. Similarly, The Conversation’s growing international audience means that it remains by far the most widely shared Australian-based opinion site on Twitter.

Even the most widely shared individual articles reveal that after the almost predictably repetitive cycles of singular attention to specific controversial decisions by the Abbott government, in this new environment interests are much more widely dispersed again: the most widely shared ABC News links in October related variously to its “Mental As” mental health awareness campaign (1,300 tweets), Rio Tinto’s use of driverless trucks in its Pilbara mine (1,200 tweets), and a special report on gun violence in the U.S. (1,200 tweets), while those for the SMH covered the new Canadian government’s change of policy in relation to a purchase of stealth fighters (1,100 tweets) and Japan’s rejection of the International Court of Justice’s jurisdiction over Antarctic whaling (1,100 tweets). We’ve not seen such even distribution of tweeting activity across so many unrelated stories for some months.

image

There are a handful of unusual patterns, but they are generally less remarkable than what we have seen in the past. There is an unusual dip in shares for ABC News articles on 29 October (which we will also see repeated in the Experian Hitwise data below); this was due to a technical outage at the ABC.

By contrast, news.com.au records a substantial boost to its numbers on 15 October, with almost 2,000 more links being shared than on comparable days – much of this spike is due to a controversial post by blogger Andrew Bolt, highlighting what he describes as “close to all-out war” between Pope Francis and Cardinal George Pell and receiving some 1,400 shares in the process. It’s quite likely that this post would have also drawn more international users than news.com.au content usually receives. Finally, The Age proves that the controversies of Prime Ministers past have not yet completely receded into the distance, with its report that Melbourne Royal Children’s Hospital doctors have refused to return refugee children to detention gaining almost 1,600 shares on 11 October alone. The fact that this spike occurred on a Sunday – normally a very quiet day for newssharing in Australia – is especially notable here.

It is tempting to suggest that the patterns we see in the Experian Hitwise data on total visits to Australian news and opinion sites are similarly reflecting a nation collectively exhaling after a prolonged period of political tension, but other factors may also be at play here. Objectively, there is a certain slowdown in news readership during the final two weeks of October, especially in relation to leading sites news.com.au and Sydney Morning Herald; in the week starting Monday 5 October we saw more than 76.8 million visits to the sites covered here, for instance, while two weeks later we only reach the 71.7 million mark.

image

But there may be some other explanations as well. The AFL and NRL Grand Finals on 3 and 4 October, and subsequent coverage of the victory celebrations, may have boosted readership numbers over the first week of the month, but those effects wash out of the system as the seasons end. School holiday periods across various Australian states and territories may also have affected visitor numbers – but those holidays had well and truly wrapped up by mid-month, so we would expect to see an increase rather than decrease in activity during the second half of October.

Overall, then, it does seem likely that the slowdown in visits to Australian news and opinion sites during these past weeks does at least partly reflect the change in political style in the country. Politics in Australia has become a little less of a spectator sport with the demise of the Abbott government, it appears.

Twitter (probably) isn’t dying, but is it becoming less sociable?

[cross-posted at Medium]

Twitter’s demise has been announced so many times over its lifetime that it’s hard to keep track of all the premature eulogies (and this one from a year ago is actually pretty insightful), but there seems to be a new intensity in the circulation of decline narratives at the moment. A couple of weeks ago there was quite a bit of heat on umair haque’s Medium story, in which he proclaimed:

Twitter’s a cemetery. Populated by ghosts. I call them the “ists”. Journalists retweeting journalists…activists retweeting activists…economists retweeting economists…once in a while a great war breaks out between this group of “ists” and that…but the thing is: no one’s listening…because everyone else seems to have left in a hurry.

Haque went on to offer his theory of the source of the trouble — abuse, incivility, and a lack of care on the platform’s part:

Twitter could have been a town square. But now it’s more like a drunken, heaving mosh pit. And while there are people who love to dive into mosh pits, they’re probably not the audience you want to try to build a billion dollar publicly listed company that changes the world upon.

Leaving aside the problem that “we” is unspecified there’s a strange contradiction here (hint: when ‘we’ is offered unreflexively it usually means ‘people like me’ — and who said we wanted it to be a town square anyway? Why not a cosy corner of the pub?) Haque’s image of death seems to involve a ghost ship populated only by blind, mutually retweeting ‘-ists’, while ‘everybody else’ has left the building; and at the same time a writhing mosh pit populated by a seething mass of too many of the wrong kind of users. I don’t want to diminish the feeling being expressed, but there is also a certain amount of early adopter angst here — it’s a structural imperative that self-defined cultural avant-gardes throw their hands up in disgust when their scenes go mainstream.

Continue reading “Twitter (probably) isn’t dying, but is it becoming less sociable?”

Anyone for Some Quick Crowdsourced Twitter Research?

Taking a quick break from the AoIR 2015 liveblogging at snurb.info: today’s presentation by Fabio Giglietto, Luca Rossi and Jiyoung Kim got me thinking. They built on a paper by Stefan Stieglitz and me which compared some basic properties of a large number of hashtag datasets (and some keyword-based datasets, too), and used these to classify different hashtag uses (mainly distinguishing between crisis events and media audiencing).

Back then, we looked at the percentage of tweets containing URLs, and the percentage of tweets that were retweets, as well as the total number of tweets in each dataset:

image
From: Axel Bruns and Stefan Stieglitz. “Quantitative Approaches to Comparing Communication Patterns on Twitter.” In Klaus Bredl, Julia Hünniger, and Jakob Linaa Jensen, eds., Methods for Analyzing Social Media. 20-44.

I’m keen to update that study with new data from more recent hashtags, and we’ve already started to work through our own archived datasets to generate further metrics. But our datasets are limited to the research interests we’ve pursued over time, and to Australian and international topics.

So, I’m wondering whether we could build this up to a much larger collection by taking a collaborative, crowdsourced approach: if anyone else out there has Twitter datasets from the past few years, could you run a handful of quick analyses over your archives and share the results? What we’d need are:

  • Hashtag(s) or keyword(s) used to capture the dataset
  • Timeframe of capture (from/to date)
  • Total number of tweets
  • Total number of tweets containing URLs – using the regular expression /http/
  • Total number of tweets containing retweets – using the regular expression /(\”@|RT @|MT @|via @)[A-Za-z0-9_]+/

You could leave those details in the comments attached to this post, or email them to me at a.bruns(at)qut.edu.au.

This is an experiment, in the spirit of AoIR collegiality. Would anyone be interested in sharing the metrics for their datasets? In return, I’d be very happy to include you as a contributing author in the paper we’ll eventually develop from this. Thanks in advance!