Taking Twitter Metrics to a New Level (Part 4)

Update: revision 1.2 of metrify.awk is now available (still at the link below), and introduces some further functionality, which is outlined here.

This is the final instalment of my four-part introduction to the metrify.awk script for generating detailed metrics for specific Twapperkeeper/yourTwapperkeeper hashtag archives. Over the last couple of posts, we’ve mainly dealt with overall stats for the hashtag, as well as for specific, definable percentiles of more or less active users. Finally, now, it’s time to look more closely at patterns within the overall userbase.

Continue reading “Taking Twitter Metrics to a New Level (Part 4)”

Taking Twitter Metrics to a New Level (Part 3)

Update: revision 1.2 of metrify.awk is now available (still at the link below), and introduces some further functionality, which is outlined here.

Over the past couple of posts, I’ve introduced our new metrify.awk Twitter metrics script, and looked at the first of the three metrics tables produced by the script. Let’s move on now to the second table, where I’ll use a snapshot of Australian political discussion on Twitter under the #auspol hashtag between February and August 2011, instead of #qldfloods – the overall metrics for the different user percentiles in the #qldfloods dataset turn out not to be particularly interesting… As before, we’re dividing the total userbase according to the 1/9/90 rule into the 1% of most active users, the next 9% of moderately active users, and the final 90% of least active users. (In the case of #auspol, that first percentile contains 142, the second percentile contains 1291, and the final percentile contains 12700 of a total of 14133 users.)

Percentile Metrics

The second table generated by metrify.awk provides us with detailed metrics on these three percentiles, on an overall basis rather than per specific time period.

This table contains the following columns:

  • percentile: the various percentiles making up the userbase, as well as total metrics for the entire userbase
  • various stats on tweets of these different types: the types match those we’ve already encountered in the previous blog post, and stats on these tweet types are provided in each case as total numbers, and as a percentage of the number of tweets posted by the user percentile in question
    • original tweets
    • @replies
    • genuine @replies
    • retweets
    • unedited retweets
    • edited retweets
    • tweets containing URLs

 
Again, too, these figures will add up to the total:

  • edited retweets + unedited retweets = retweets
  • retweets + genuine @replies = @replies
  • original tweets + genuine @replies + retweets = total number of tweets

 
and

  • % edited retweets + % unedited retweets = % retweets
  • % original tweets + % genuine @replies + % retweets = 100%

 
(with tweets containing URLs again constituting a separate category, since any type of tweet may also contain URLs).

Some Results

Applying this to our #royalwedding #auspol dataset, here’s what the activities of the different user percentiles look like:

image

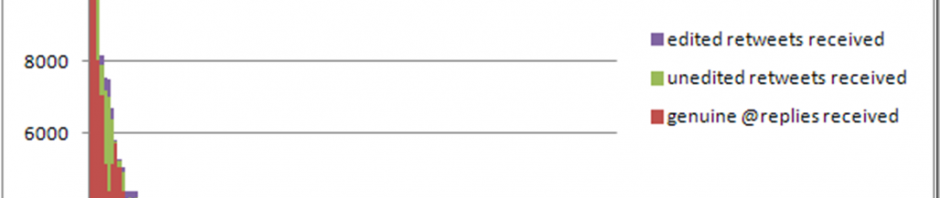
We’re clearly seeing some very significant differences between the various percentile groups here. Interaction amongst the top 1% of most active users is especially discursive, with more than 55% of all of their tweets constituting genuine @replies: these people are very actively talking to (or at) one another.

The next lower group of active users, by contrast, doesn’t engage as much: only one third of their tweets are genuine @replies, but nearly 39% are original tweets. They’re more active at posting their own views and comments, rather than responding to others – or at least (and this is important to keep in mind with any such metrics), they’re less in the habit of also marking their @replies with the #auspol hashtag. By contrast, the top group are much more overtly performing their conversations, making them visible to all followers of #auspol; the second group may well send their own @replies, but if those @replies don’t contain the hashtag #auspol, they’re less visible to others and not included in our hashtag dataset.

Finally, too, the least active 90% of users are participating differently again: some 52% of their tweets are retweets, so (given that they’re not posting to #auspol that often in the first place) they’re probably more likely to be present here simply as ‘drive-by’ retweeters who occasionally pass along an interesting #auspol-tagged message that shows up in their Twitter feeds, but don’t deliberately follow the continuing #auspol conversation itself.

image

There are two more useful statistics to examine for #auspol, and I’ve combined them in the graph above: first, the percentage of the total volume of #auspol tweets that each group is responsible for (shown here in blue): the one percent of most active users – a total of 142 Twitter users, for the period we’re looking at – accounts for a staggering 62% of all #auspol tweets. In other words, Australian political discussion on Twitter, under the #auspol banner, is dominated by a vanishingly small group of users whose output is massively disproportional to the size of the group. Compare this with the least active 90%: those more than 12,000 users contribute less than 9% of all #auspol posts. Quite a difference – #auspol shows a very strong long-tail distribution amongst its active participants, then. (This is very different for many of the crisis-related hashtags we’ve looked at, by the way: the top 1% of most active users in #qldfloods, for example, are responsible for less than 17% of all tweets; the least active 90% of #qldfloods users for nearly 57%.)

Second, the distribution of tweets containing URLs is also interesting here. We already know that the lowest 90% are more likely to retweet than post their own commentary or @replies – and it looks like many of those retweets are of posts containing URLs: some 37% of all tweets by the bottom 90% include links. By contrast, the discursive few at the top of the activity scale include URLs in only 18% of their tweets.

Percentile Metrics, Compared

But beyond these metrics for the various user percentiles in individual hashtags, we can also compare these findings across different hashtag datasets – and that’s where things get really interesting. There are very many possible comparisons here: how do the individual percentiles of users compare across the different hashtags (something I’ve already hinted at above, comparing the relative contribution of the top 1% in #auspol and #qldfloods, for example), which hashtags contain more @replies, retweets, URLs, etc.?

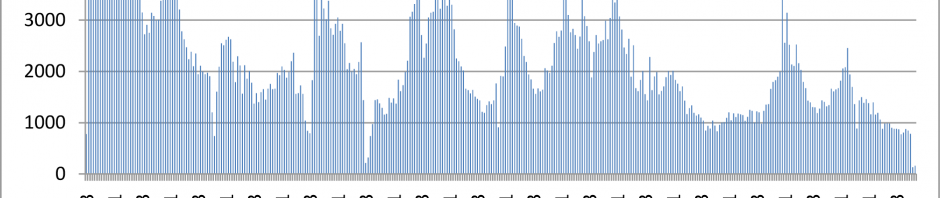
We’ve only scratched the surface on these broader comparisons, but one very interesting pattern which has already emerged is shown in the graph below (which remains preliminary; one of my plans for the next month or so is to develop this further):

image

Here, we’re comparing the total metrics (for all users, rather than for specific percentiles) across a range of different hashtags: #qldfloods, #eqnz, the Japanese #tsunami, #libya, the #londonriots, #ukriots, and #riotcleanup, the #royalwedding, election nights in Australia and Ireland (#ausvotes and #ge11), the Tour de France (#tdf), #eurovision, and #wikileaks. The size of each point on the graph shows the total size of the userbase for each hashtag – so, the #royalwedding and the #tsunami attracted a vastly larger Twitter userbase (of around half a million unique users each) than the Irish election or Queensland floods, for example.

But what the graph shows is that independent of the size of the userbase, there are some very obvious patterns here. All of the crisis events are characterised by a large number of both (unedited) retweets and tweets sharing links; people are actively finding and disseminating information. All of the widely televised events, on the other hand, have very few URLs, and only marginally more retweets: Twitter may be used as a backchannel for the television, in a shared experience of audiencing, but there’s not much additional information sharing going on here. #wikileaks, in turn, is a different story altogether – but perhaps we’ll come across more hashtags with similar metrics, and it’s the first sign of a third major category.

I’m reluctant to read too much more into these patterns as yet – first, I’ll need to do some more work cleaning up the datasets which the graph above is based on (working out which exact periods of time to use for each hashtag, and trying comparisons of a few more different combinations of metrics. I do think there’s a first sign in this of much more fundamental patterns in how Twitter hashtags are used for specific purposes. But that’s a longer discussion for another time.

And we haven’t yet exhausted all the possibilities which metrify.awk itself offers. In addition to the time- and/or percentile-based metrics which we’ve discussed over these last couple of posts, it also calculates metrics for each individual user in the dataset. And that’s what we’ll look at in the final instalment in this series.

Taking Twitter Metrics to a New Level (Part 2)

Update: I’ve clarified/corrected some of the details relating to the percentile metrics contained in the first table which metrify.awk generates.

Update 2: revision 1.2 of metrify.awk adds further functionality in addition to what is described below. These changes are detailed here.

In the previous post, I’ve introduced metrify.awk, our new multi-purpose tool for generating Twitter metrics. Over the next instalments in this series of posts, I’ll take you through the results it produces. And seeing as we’re coming up to the anniversary of the January 2011 south-east Queensland floods, and as I needed to generate those metrics anyway, for a report on social media in the floods which we’re publishing soon, I’ll be using an archive of #qldfloods tweets between 10 and 17 January 2011 as an example here.

I’m running metrify.awk as follows for this:

gawk -F , -f metrify.awk divisions=90,99 time=day qldfloods.csv >qldfloods-metrics.csv

In other words, we’re using a 1/9/90 division of users, and we’re tracking activities per day; the skipusers switch is not set, so full stats for all users will be generated.

Continue reading “Taking Twitter Metrics to a New Level (Part 2)”

Taking Twitter Metrics to a New Level (Part 1)

So, 2011 is finally over – and what a year it’s been. While the confluence of natural disasters, political crises, and other major events has also provided us with the basis for a new research programme in crisis communication, let’s hope that 2012 is a little less intense, please…

To start the new year on a positive note, I’m finally getting around to sharing some more information about the new approach to generating Twitter metrics which we’ve developed over the past few months – this actually started during the research workshops we had with Stefan Stieglitz’s group at the University of Münster in August, so it’s taken some time to gestate into its present form. What it’s now turned into is quite a powerful tool for generating detailed information about a specific Twitter dataset – intended mainly for the study of hashtags, but with applications well beyond this as well. Amongst other things, it enables us to distinguish more effectively between different groups of participating users (from highly active lead users to much less active casual participants), and to track different types of participation, in total or by these specific groups, over time.

Continue reading “Taking Twitter Metrics to a New Level (Part 1)”

Some New Publications

As 2011 winds down (which may also give me the time to do some more Gawk coding again – watch out for more updates soon), we’re still in the process of harvesting the results of our work over the last twelve months. Over the past few weeks, a clutch of articles based on our Mapping Online Publics research have finally seen the light of day:

Continue reading “Some New Publications”

New ARC Linkage project: Social media in times of crisis

This morning the Australian Research Council announced the latest round of major grant funding, and I’m pleased to be able to report some very good news. Along with our CCI colleagues Kate Crawford and Terry Flew, Axel and I were awarded funding for a Linkage Project on the uses of social media for crisis communication, which we’ll conduct in partnership with the Queensland Department of Community Safety, Brisbane-based public policy think tank Eidos Institute, and our colleagues at Sociomantic Labs:

Social Media in Times of Crisis: Learning from Recent Natural Disasters to Improve Future Strategies

Recent Australian and international natural disasters have demonstrated the changing shape of public communication in times of crisis. Mass media and face-to-face communication are now complemented by a variety of channels from SMS to social media platforms like Twitter and Facebook.

This project combines large-scale quantitative and close qualitative analysis to investigate the public use of social media during disasters, working with key emergency management organisations to improve their communication strategies. It will highlight successful approaches as well as potential pitfalls; the strategies which the project will develop and test will help to make emergency responses in natural disasters faster and more effective.

The project builds on and substantially extends the various bits of work we’ve already been doing in this area, and which we’ve reported on in this blog and elsewhere over the last several months (and here I should especially acknowledge the contribution of Frances Shaw at UNSW). Really looking forward to getting going on this one in the new year – stay tuned for updates!

Twitter and Crises: #qldfloods, #eqnz, and #SJ

OK, it’s taken a little while, but we’ve now finally put all the presentations from our panel on social media and crisis communication at the Association of Internet Researchers conference in Seattle in October online. Three of the four have audio as well – my apologies to our last presenter, Anders Larsson, but the batteries on my audio recorder ran out just as he got started!

Continue reading “Twitter and Crises: #qldfloods, #eqnz, and #SJ”

A Call to Action on Social Media Archiving

(Crossposted from snurb.info. Longer post there.)

Briefly back in Australia, yesterday I went down to Sydney to speak at the Australian Society of Archivists’ 2011 Symposium (staged at the fabulous Luna Park venue). My paper was meant as an urgent call to action on the question of archiving public activities in social media spaces – so much material which will be of immense value to future researchers is being lost every day if we don’t get our act together very soon; we can’t wait for the lumbering beast that is the U.S. Library of Congress to do the job for us, however fulsomely they’ve promised to archive the full public Twitter firehose. The truth is, here in Australia we already have the technologies for capturing and archiving large datasets of public communication on Twitter and elsewhere – but someone with the necessary public standing and archivist expertise (the National Library, the National Archives, …) must now take the initiative; the sooner, the better.

My paper (with audio) is below:

Talking Crises in Perth

I was briefly in Perth on Friday, to present our research into the use of Twitter for crisis communication during recent natural disasters at the RightClick 2011 event organised by the Institute for Public Administration Australia. A stimulating day with some very interesting speakers – many thanks to the organisers for the invitation!

Below are my slides, with audio. The next stops for Jean and me will be Taipei (where we’re participating in a crisis communication workshop with our colleagues from National Cheng Chi University) and Seattle (for the 2011 Association of Internet Researchers conference). More from those events soon…

Sony Hacking Coverage on Twitter

Hi! Let me introduce myself–my name is Tanya Nitins and I’m working with my QUT colleagues Axel and Jean, and researchers based at the University of Muenster on an ATN-DAAD project (see related blog post here). My particular research interests in relation to this project center around brand development and management in social media, with a particular emphasis on entertainment industries. The research collaboration between QUT and Muenster is focusing on deciphering the new dynamics of brand communication in the context of social media. In particular, we want to understand how businesses monitor and respond to negative publicity and/or criticism in such social media sites as Twitter.

Continue reading “Sony Hacking Coverage on Twitter”