ATNIX: Australian Twitter News Index, December 2014

The final ATNIX for 2014 arrives with a slight delay due to the summer holidays, but covers an unexpectedly dramatic few weeks in Australian public life, due especially to the deadly siege in the Lindt Café in Sydney’s Martin Place in mid-December. This major breaking news story and its tragic aftermath are clearly reflected in the patterns of news sharing on Twitter and in the patterns of access to major Australian news sites as we’re seeing them in the data provided by Experian Marketing Services, but there are also clear differences between the specific response of Twitter users and the more general news access patterns which are instructive of how Internet users respond to such key events.

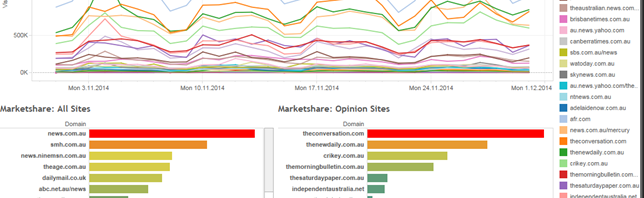
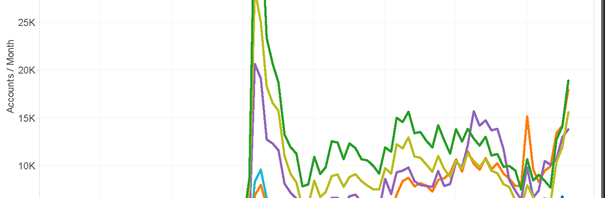
In the absence of any major events, what the Australian Twitter News Index should show us in December is a gradual decline of new sharing activity as we enter the slow news space of the Australian summer, with even market leader ABC News struggling to pass the 5,000 tweets/day mark. The December 2014 ATNIX diverges from that pattern several times, however: in addition to the roughly threefold increase in overall link sharing volume during the Sydney siege and its aftermath on 15 and 16 Dec., there is in fact also a similar spike in traffic one week earlier, on 8 Dec. (we did not capture any data for the first few days of December, due to server maintenance).

image

This first spike is caused by the unexpected death of writer, comedian, and disability rights campaigner Stella Young, which generated a substantial response from the Australian Twittersphere. Several of the stories reporting Young’s death and reflecting on the achievements of her life were very widely shared – including especially those published by ABC News, the Sydney Morning Herald, and The Age –, and the strong social media reponse to her death also became a story in itself. Young’s “Letter to Herself at 80”, published in Fairfax papers only a few weeks before her death and republished again in response, was also widely shared again.

Such a strong response reflects in part also the comparatively high-brow nature of news sharing interests in the Australian Twittersphere, where quality news sites tend to dominate. Notably, there is no corresponding increase in total site visits to Australian news sites during the same days: while the Twittersphere reacted strongly to Young’s death, therefore, it appears that the same is less true for the greater Australian public.

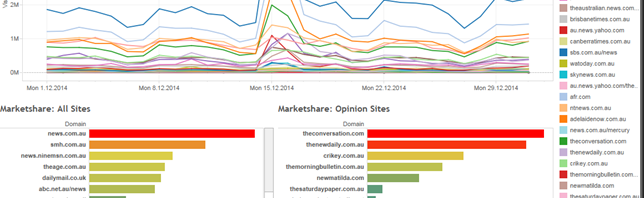
By contrast, there are matching spikes both in the number of links shared and in the number of visits to Australian news sites during and after the Sydney siege – and the range of URLs shared on Twitter during the event also differs considerably. Sites whose stories are featured prominently during the event include ABC News, and the Sydney Morning Herald, again (though not The Age, as a Melbourne- rather than Sydney-based publication), but also news.com.au, Yahoo!7 News, The Australian, the Herald Sun and the Daily Telegraph.

In most of these cases, the various live blogs and live streams these sites offered (including especially also the live streams for ABC News 24, on the ABC News site, and 7 News Sydney, at Yahoo!7 News) were especially widely redistributed, and would also have been shared in tweets by non-Australian Twitter users. While such international shares necessarily inflate the volume of link sharing activity capture by ATNIX, a comparison with the total volume of news sites visits as captured in our Experian Marketing Services data (which covers Australian users only) also shows the very substantial increase in domestic attention to Australian news sites.

image

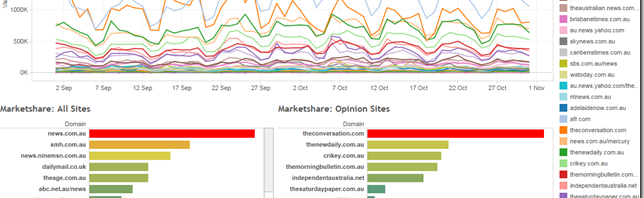
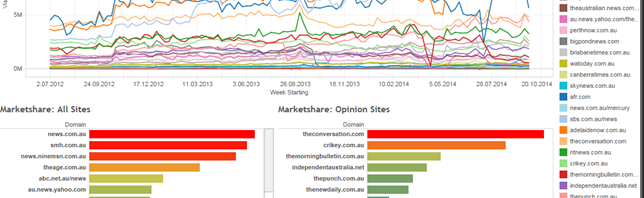
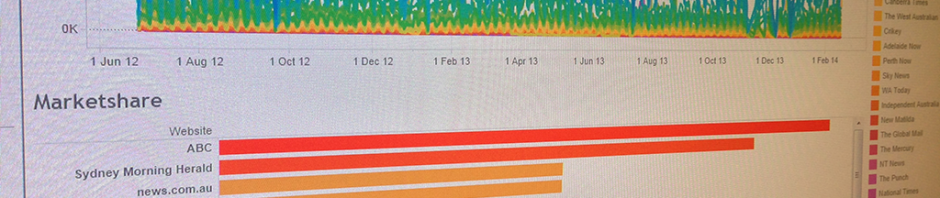
Notably, and again reflecting the more high-brow news focus of the Australian Twittersphere when compared to the overall Australian Internet user population, a somewhat different set of sites receive greater attention during the Sydney siege. Market leaders news.com.au and Sydney Morning Herald receive well over twice their average number of visits during the crisis, and NineMSN and ABC News also increase their audience substantially; as on Twitter, however, the Melbourne-based Age fails to attract similar numbers to its coverage.

Yahoo! 7 News records an even more dramatic increase: hovering normally just above the 100,000 visits mark, its coverage (initially produced from offices just across the road from the Lindt Café) attracts more than one million visits on 15 December. Sydney’s Daily Telegraph more than doubles its usual number of site visits, too, but its strongest day (with over 1.1 million visits) is 16 December, perhaps due to its controversial coverage of the siege aftermath. (Similar patterns apply to Brisbane’s Courier-Mail and to The Australian, incidentally.)

The divergent patterns we see across ATNIX and the Experian Marketing Services data on total site visits to Australian news sites during December offer useful insights into the ways that Australians found out about and engage with the news, especially around breaking news events. Twitter (and, by extension, other social media platforms) is clearly important in sharing breaking news – and indeed, some breaking news events, such as the death of Stella Young, clearly generate a much stronger echo amongst the specific demographics of the Australian Twittersphere than they do across the greater Australian public.

But the composition of what is being shared on Twitter, in terms of popular sites and sources, does not necessarily influence and reflect the broader usage patterns of the Australian Internet population: here, different sites tend to dominate the market, and this does not appear to change substantially even though Twitter users are strongly promoting specific sources of new information about unfolding events. It is difficult to conclusively ascribe causality here, of course: do visits to Yahoo!7 News’ coverage of the siege increase dramatically because Twitter users are sharing links to it to an unusual degree, or is the increased link sharing in fact caused by those unusually many visits? We’ll seek to explore the evidence for either interpretation in further analysis.

But whether Australians find out about breaking news through Twitter and other social media, or by other means: online news sites, and the live blogs and live stream they provide, clearly have become a key source of information by now.

Standard background information: ATNIX is based on tracking all tweets which contain links pointing to the URLs of a large selection of leading Australian news and opinion sites (even if those links have been shortened at some point). Datasets for those sites which cover more than just news and opinion (abc.net.au, sbs.com.au, ninemsn.com.au) are filtered to exclude the non-news sections of those sites (e.g. abc.net.au/tv, catchup.ninemsn.com.au). Data on Australian Internet users’ news browsing patterns are provided courtesy of Experian Marketing Services Australia. This research is supported by the ARC Future Fellowship project “Understanding Intermedia Information Flows in the Australian Online Public Sphere”.

ATNIX: Australian Twitter News Index, November 2014

With the drama and excitements of the Melbourne Cup and G20 summit receding into memory, and the current trials and tribulations of the federal government taking centre-stage once again, it’s time to update our Australian Twitter News Index (ATNIX) for the month of November. Sadly, scheduled server maintenance has meant that we’ve missed out on news sharing data for the final week of November, so this update will cover only the period until the 24th – but it provides some useful insights and a handful of surprises nonetheless (as always, click to enlarge the graphs below).

First, what’s striking about the Twitter link-sharing patterns for November is most of all their stability: there’s no obvious G20 bump in activity on 15 and 16 November. This is not an uncommon pattern in our observations over the years, in fact: events such as the G20, which are already very well covered by the mainstream media and tend not to generate a great deal of unforeseen surprises, usually fail to enthuse users into sharing further news stories on Twitter. The logic behind this, perhaps, is that anyone who paid any level of attention to the media during this period would have already encountered the blanket coverage of the G20, so there’s very little need to engage in any additional news sharing.

image

Where there are unusual bumps in activity, they remain entirely non-event-related. ABC News’s strong performance during the first week of November, for example, has very little to do with the Melbourne Cup, but is instead due for the most part to its coverage of exceptionally beautiful ‘fallstreak hole’ cloud formations over eastern Victoria; not only did this article receive substantial attention from Australian users, but it also gained some international virality over a period of several days. Similarly, during week two news.com.au briefly rises above its long-term average as it covers a greased-up Kim Kardashian’s latest media stunt, which didn’t quite “break the Internet” as advertised, but certainly resulted in a handful of extra links being shared.

As we’ve seen time and again, what generates above-average news sharing on Twitter is breaking, unforseen, and surprising news, then; by contrast, the tacit assumption is that everyone has already seen the major news items of the day. And apparently this applies even to the Melbourne Cup, made especially tragic this year by the sudden death of race horses Admire Rakti and Araldo.

Of course this doesn’t mean that online audiences fail to be interested in these events and topics. Turning to our Experian Hitwise data on Web browsing patterns in Australia for the same sites and timeframe, it is obvious that The Age, ABC News, the Herald Sun and a number of other sites record clear spikes in readership on Melbourne Cup Day, so clearly there’s considerable attention to the event and its sad aftermath. Interestingly, there is far less enthusiasm for the G20: while the regular weekend slump in online news readership is perhaps somewhat less pronounced on 15 and 16 November, audiences are certainly not glued to their computer screens as the world leaders deliberate. Perhaps online is trumped here by the considerable television coverage which the event also received.

image

There are clear spikes in readership across most of the leading news sites on 27 November, however, and I would not be surprised if this is directly related to cricketer Philip Hughes’s death that day. In the absence of any data for the week, I would also assume there to have been a spike in tweets sharing news stories related to this tragedy, especially in connection with the #putoutyourbats campaign.

Beyond such day-to-day fluctuations, aggregate patterns are also worth noting. In links shared on Twitter, The Conversation almost caught up with The Australian during November (keeping in mind again that we were unable to gather data for the final week of the month); a particularly strong performance which may have been aided somewhat by The Conversation’s continuing expansion into the US market, however. Overall, aided by its coverage of celestial phenomena, ABC News stepped well clear of close competitor Sydney Morning Herald this month, while The Age regained third spot from news.com.au.

In terms of overall site visits as recorded by Experian Hitwise, the situation is considerably more stable. Here, The Age advanced to fourth spot on the back of its Melbourne Cup coverage, while all other rankings remained stationary; most notably, the G20 Summit had little impact on the placing of local sites Courier-Mail and Brisbane Times. Amongst the opinion sites, The Conversation remains the clear market leader, but The New Daily continues its strong run and is now well clear of closest pursuer Crikey – all the more surprising because such readership has yet to translate into link-sharing on Twitter. By contrast, Independent Australia has lost ground and has fallen back behind The Saturday Paper. (Note that we’ve had to temporarily exclude New Matilda from the list, due to a data issue; I’ll update this post once the issue is resolved.)

Standard background information: ATNIX is based on tracking all tweets which contain links pointing to the URLs of a large selection of leading Australian news and opinion sites (even if those links have been shortened at some point). Datasets for those sites which cover more than just news and opinion (abc.net.au, sbs.com.au, ninemsn.com.au) are filtered to exclude the non-news sections of those sites (e.g. abc.net.au/tv, catchup.ninemsn.com.au). Data on Australian Internet users’ news browsing patterns are provided courtesy of Experian Marketing Services Australia. This research is supported by the ARC Future Fellowship project “Understanding Intermedia Information Flows in the Australian Online Public Sphere”.

ATNIX: Australian Twitter News Index, September/October 2014

In my previous post, I introduced the revamped and rebooted Australian Twitter News Index, which now covers both link sharing patterns on Twitter for Australian news and opinion sites and general online popularity trends for those sites. Having covered the long-term trends since 2012 in that post, it’s now time for the first monthly update on the tweeting and browsing activities around these sites – and in this first instalment, we’ll cover the September/October period.

Over this timeframe, we saw the usual tight contest between ABC News and the Sydney Morning Herald for the top spot on Twitter – more than 400,000 links to either of these sites were shared in September and October combined. The second-tier leadership race is as close, with both news.com.au and The Age receiving more than 170,000 links. Amongst the opinion sites, The Conversation (105,000 links) leads by a substantial margin, but as always we should note that its numbers are inflated by its significant international reach. (Click the graphs to enlarge.)

image

Most notable in the day-to-day link sharing patterns for this period is the significant spike in activity for The Australian on 2 October, however: that day, it rises to some 14,000 shared URLs, well above its usual paywall-affected baseline around the 2,000 mark. What we see here is an example of a story going viral on Twitter well beyond The Australian’s usual audience: its piece on the complete abolition of university tuition fees in Germany was  the focus of several widely retweeted messages, with a tweet from Iowa-based TV news anchor David Nelson receiving more than 10,000 retweets alone. A less substantial spike of more than 11,000 links for the Sydney Morning Herald on 8 October is also partly caused by such international virality: its profile of the Western Sydney Wanderers’ Asian Champions League finals opponents Al-Hilal was referred to in more than 2,300 Arabic-language tweets, while its coverage of the lunar eclipse that day also received significant attention.

A comparison with the Experian Hitwise data on Web browsing patterns in Australia for the same sites and timeframe reveals significant differences, however. Here, news.com.au remains clearly at the top of the leaderboard, while The Conversation maintains a similar lead amongst the opinion sites. Their respective leading margins over their nearest competitors are substantially greater than we would expect from the long-term averages we discussed in the previous post, in fact; this continues news.com.au’s strong performance since the start of 2014, in particular.

Meanwhile, in news Daily Mail Australia has overtaken The Age in the total number of visits it received over these two months, and in opinion Crikey is dealing with serious competition in the form of The New Daily, The Morning Bulletin, and Independent Australia – something of a surprise in the case of the first two publications, since neither have yet begun to feature especially strongly in the Twitter data, where opinion sites are usually performing comparatively strongly.

image

By contrast, a closer look at the impact which The Australian’s unexpectedly viral university fees story on 2 October had on its overall baseline of site visits provides a useful cautionary tale to any newspaper editors who might use such anecdotal observations as justification to publish a greater number of clickbait pieces: there was no discernible change in the total number of visits to The Australian’s Website (averaging at around 170,000 visits per day) on or after 2 October.

Standard background information: ATNIX is based on tracking all tweets which contain links pointing to the URLs of a large selection of leading Australian news and opinion sites (even if those links have been shortened at some point). Datasets for those sites which cover more than just news and opinion (abc.net.au, sbs.com.au, ninemsn.com.au) are filtered to exclude the non-news sections of those sites (e.g. abc.net.au/tv, catchup.ninemsn.com.au). Data on Australian Internet users’ news browsing patterns are provided courtesy of Experian Marketing Services Australia. This research is supported by the ARC Future Fellowship project “Understanding Intermedia Information Flows in the Australian Online Public Sphere”.

From ATNIX to Hitwise: Australian Online News Audiences, 2012-14

It’s been a long time since I’ve published the Australian Twitter News Index (ATNIX) on a semi-regular basis – other commitments got the better of me for some time, I’m afraid. In addition, I’ve also needed to make a number of technical changes to make the index more manageable and sustainable, and I’ve outlined some of these developments here.

I’m now getting ready to get ATNIX started up again, though, and hopefully to make some further additions that will prove useful in the longer term. To get us started, I thought it might be useful to post a long-term overview of ATNIX trends since we started the index in mid-2012. Over the past two years, we’ve seen a growing adoption of Twitter in Australia, to a point where there are now more than 2.8 million accounts in the Australian Twittersphere – and it seems logical that this would also manifest in changes to the sharing patterns for Australian news sites on Twitter.

Indeed, the total volume of tweets sharing links to Australian news sites has increased during these two years – as has, it should be noted, the number of news sites we’ve tracked. In total, since mid-2012 (and allowing for a handful of server outages), we’ve captured some 20 million tweets in total, containing more than 24.5 million URLs. And those numbers have increased steadily: while in July 2012, we saw a total of 677,000 tweets linking to our Australian news sites, by July 2014 that number had grown to more than one million. (In fact, 2014 has seen particularly strong growth, perhaps due to the substantial confluence of various domestic and international events and crises.)

Broken down across the 35 Australian news and opinion sites we are currently tracking, these patterns look as follows (click to enlarge, and ignore the obvious drop-outs due to server maintenance in November 2013):

image

For long-term followers of our ATNIX data, it is immediately evident that the overall rankings amongst the major news sites have remained largely stable: ABC News and the Sydney Morning Herald remain the most widely shared news sites in Australia by some margin (and, it seems, by a margin that continues to increase relative to their nearest competitors). In the second tier, The Age and news.com.au are similarly running neck-and-neck. And they are followed, finally, by the rest of the field, with some of those sites occasionally recording major spikes due to the viral dissemination of single stories.

A closer look reveals a few more interesting patterns, however. The SMH appears to have recovered from a lengthy slump in popularity that began in early 2013, which saw it fall back from ABC News’ tail, and since April 2014 has been shadowing its major competitor much more closely once again. Amongst the opinion and commentary sites, The Conversation is the obvious market leader, though this is also boosted by its new-found transnational reach, with strong take-up in the UK and elsewhere – and it should be noted that following the site’s conversion from a .edu.au to a .com address we missed some months of data early this year, so its lead over nearest competitor Crikey would likely be even greater. And overall, the greatest spike in news sharing activity occurred, unsurprisingly, during the last federal election, when we captured more than 50,000 tweets linking to ABC News for the election week alone.

Sadly absent from this chart, however, are Guardian Australia and Daily Mail Australia. Due to their lack of a dedicated Australian domain, or of any other markers identifying their Australian coverage, we’re unable to separate Australia-specific news sharing activities from the global Guardian and Mail brands, and therefore cannot include them here. (We’re choosing to include The Conversation despite its now international audience, however, because it originated and continues to be substantively based in Australia.) Eventually, as we develop our data gathering approach further, we hope to develop the methods to better identify Australian-based sharing of news from these sources.

Introducing Experian Hitwise Data

As we develop ATNIX further, we also hope to place it into a wider context by comparing these Twitter-based news sharing patterns with reading and sharing activities elsewhere. We’ll soon attempt to tackle Facebook, but for now, here’s a glimpse of a very different data source: Experian Hitwise. Experian Marketing Services collects anonymous data at ISP level through opt-in panels about the Web searching and browsing patterns of Australian Internet users, and in the graph below I’ve compiled the site visit statistics for the same sites which we are tracking as part of ATNIX, for the same timeframe:

image

Total visits to Australian news and opinion sites, July 2012 to September 2014. Data courtesy of Experian Marketing Services Australia.

Once again, a significant rise in the total number of visits to news sites by Australian Internet users since the start of 2014 is evident, corresponding to a similar rise in news sharing during this time; we’re also seeing a matching dip in late April/early May, during the Easter / ANZAC Day holiday period. However, the ranking of news sites is markedly different: since early 2014, the market leader in Australian online news is news.com.au, even if such leadership doesn’t result in a similarly strong result in news sharing as we measure it through ATNIX. Conversely, ATNIX leader ABC News ranks ‘only’ fifth amongst the most read news sites in Australia.

Amongst the opinion and commentary sites, The Conversation and Crikey lead the Experian Hitwise rankings, too, but the rest of the leaderboard is structured quite differently. This is probably an indication of the respective positioning of these sites: to attract a loyal readership in their own right, to encourage the viral distribution of their articles, or both. Experian Hitwise records a surprisingly strong readership for The Morning Bulletin, for example, while ATNIX does not show its content to be very widely shared through Twitter; conversely, New Matilda content is widely shared, but according to the Experian Hitwise figures it does not seem to have a very large regular audience.

And finally, the Experian Hitwise numbers also provide us with a glimpse of Guardian Australia’s and Daily Mail Australia’s market positioning: by late September they’ve managed to rise to eight and fifth place on the Experian Hitwise chart, respectively, and continue to trend gradually upwards. We’ll watch their further development with interest.

Standard background information: ATNIX is based on tracking all tweets which contain links pointing to the URLs of a large selection of leading Australian news and opinion sites (even if those links have been shortened at some point). Datasets for those sites which cover more than just news and opinion (abc.net.au, sbs.com.au, ninemsn.com.au) are filtered to exclude the non-news sections of those sites (e.g. abc.net.au/tv, catchup.ninemsn.com.au). Data on Australian Internet users’ news browsing patterns are provided courtesy of Experian Marketing Services Australia. This research is supported by the ARC Future Fellowship project “Understanding Intermedia Information Flows in the Australian Online Public Sphere”.

Rebooting ATNIX, using MySQL and Tableau

During 2012 and 2013 I published a more-or-less-weekly overview of the news sharing patterns in the Australian Twittersphere, the Australian Twitter News Index (ATNIX), which I also crossposted to my column at The Conversation. Technical issues and the call of other commitments have forced me to put ATNIX on the backburner for some time, but it’s time now to update and restart the index. This post is about the methods used to generate ATNIX – and soon I’ll also post a first new analysis of the data.

First, a reminder: ATNIX builds on the fact that, given a domain name like abc.net.au, the Twitter search API will return all tweets which contain a link to that domain, even if the link has been shortened by Twitter’s mandatory URL shortener t.co and/or one of the other common URL shorteners (bit.ly, ow.ly, etc.). This makes it possible to use yourTwapperkeeper or other tracking tools to capture all of the tweets that link to one or more given domains, on an ongoing basis. As always with Twitter, there are limits to this approach, of course: first, strangely, the Twitter streaming API doesn’t provide identical functionality: tracking a term like abc.net.au there does precisely nothing. This means that (for the time being) we’ll continue to generate ATNIX using our trusty yourTwapperkeeper rather than more powerful tools like DMI-TCAT, since for tracking tweets the latter relies on the streaming API alone. Second, data gathering using the standard Twitter API is subject to Twitter’s 1% rule: we’ll miss tweets if the search results we should be getting add up to more than 1% of the total, global tweet volume at the time. This seems unlikely in our present context unless an article on an Australian news Website goes viral on a global basis, however.

Those limitations aside, we’re therefore able to track Australian news sharing patterns on Twitter by tracking a list of Australian domain names. Our current list includes some 35 domains of news and commentary sites ranging from abc.net.au to watoday.com.au, and from crikey.com.au to thesaturdaypaper.com.au. There are some problematic cases, though: since its move from theconversation.edu.au to a .com address, and its establishment of a UK and international contributor base, The Conversation has a much broader audience than just Australian users, so its numbers may be somewhat inflated by comparison with Australian-only opinion sites – and comparatively recent international entries into the Australian news environment such as The Guardian and Daily Mail continue to operate their Australian editions under .com and .co.uk domains, respectively, with no way to distinguish specifically Australian content on the basis of the URL alone.

Given that The Conversation started in Australia and retains a very strong readership here, we’ll continue to include it in ATNIX, then (but with strong caveats), but I’m afraid The Guardian and Daily Mail won’t be covered by ATNIX for the time being. In addition, we’ll also filter the data to exclude some sections of Websites which cover more than news alone – for example, abc.net.au’s TV guide, or sbs.com.au’s (very popular) Pop Asia section. We’re also using the full resolved URL to distinguish between Yahoo!7 News (au.news.yahoo.com) and The West Australian, which is also hosted by yahoo.com (at au.news.yahoo.com/thewest). In the past, ATNIX has also used such URL paths to distinguish between news and opinion content on some of the leading news sites, but recent site redesigns at the ABC and on Fairfax sites have meant that news and opinion content can now no longer be distinguished in this way. So instead of this distinction we’ll add a new table that focusses specifically on the opinion-only sites.

From CSV and Excel to MySQL and Tableau

So far, so good – this method of gathering and processing our data hasn’t really changed much since we started ATNIX. However, our previous method of storing and analysing these datasets (as comma- or tab-separated files, and in Excel) has become more and more unsustainable the longer we’ve continued ATNIX, since the longitudinal analysis of these datasets rapidly causes problems for Excel with its antediluvian limit of a maximum of ~1 million data rows per spreadsheet. ATNIX often pulls in more tweets than that in a single month. The solution to this is the popular ‘big data’ analytics tool Tableau, which has no such limits to the size of its datasets, and is also able to connect to a range of database solutions rather than being limited to working with static data files.

It’s tempting to move immediately to a NoSQL solution for storing our ATNIX data, then, but for the moment (with some tens of millions of tweets in our current ATNIX dataset) a standard MySQL setup will still be sufficient (and once the data are in MySQL, transferring them to a more powerful cloud-based solution will be comparatively easy, anyway). So, the first step is to import our raw tab-separated data files (originally in yourTwapperkeeper format, and now with a few more columns added following the URL resolution process) into MySQL. Once we’ve set up a table with the right field structure, this is comparatively easily done by using a LOAD DATA statement in MySQL – but there’s a catch: as it turns out, MySQL takes a somewhat unusual approach to parsing input files for escape characters.

We’re using tab-separated files in order to ensure that commas and quotation marks in the raw tweet data don’t cause any problems in identifying the start and end of fields and rows correctly. (My modifications to the original yourTwapperkeeper export functions, available here, have already stripped out any stray tab or newline characters from the original tweets.) But when it imports data from a file, MySQL also pays attention to the \ character, treating any backslash as an escape character rather than a literal backslash. This is especially problematic if the backslash is followed by a letter like ‘n’ or ‘t’ – in a tweet, \n/ would therefore be treated as a newline character followed by a slash, and break the data being imported. Similarly, a \ at the very end of a tweet would escape the field-separating tab character which follows, so that all columns in the current row move left.

This behaviour can be fixed with a simple Gawk helper script, though, which escapes all backslashes in our import file by doubling them:

# escapebackslashes.awk - replaces any single backslash \ with an escaped backslash \\ ahead of MySQL importing
#
# usage: gawk -F , -f escapebackslashes.awk original.csv >escaped.csv
#
# Released under Creative Commons (BY, NC, SA) by Axel Bruns - a.bruns@qut.edu.au

{
	gsub(/\\/, "\\\\")
	print
}

After importing the TSV file, all those double backslashes are single again.

Loading the escaped datafile into MySQL is easy if a table containing the correct columns has been set up. The SQL query to do so will depend on the table structure, but will look something like this:

LOAD DATA LOCAL INFILE '…filename…'
  IGNORE 
  INTO TABLE `…table…`
  CHARACTER SET 'latin1'
  FIELDS TERMINATED BY '\t'
  LINES TERMINATED BY '\n' 
  IGNORE 1 LINES 
(
  field1, field2, field3, …
)

Moving our entire ATNIX dataset since mid-2012 into a single MySQL database has taken me some time, but we now finally have a full set, and the capability to continue to update it with new data as data gathering for ATNIX continues. In this database, each row contains a single tweet, including the tweet text, all the metadata gathered by yourTwapperkeeper, and the additional fields for the resolved URL which our URL resolution process has added. With this, we’re ready to explore the data using Tableau.

Introducing Tableau

In addition to reading CSV, TSV, and Excel files, Tableau (which is free to licence for students, incidentally) is able to plug directly into MySQL and other databases – all that’s required are the server and login details. Where it surpasses Excel (other than in not being limited to just over one million rows per dataset) is in being able to abstract from the raw data on the fly: advancing well beyond what Excel has to offer, Tableau is all pivot tables, all the time. We’re able to feed it the raw ATNIX data, tweet for tweet, and from this generate day-to-day, week-to-week, and month-to-month activity patterns, distributions of attention across the various news sites, and rankings of the most active news sharers directly, without the tedious steps of data processing, extraction, and aggregation which would have been required in Excel; we’re even able to define standard analytics dashboards which can be re-used time and again. And because we’re still working directly with the raw data in doing so, we nonetheless retain the ability to drill down immediately to the individual tweets which are responsible for specific phenomena showing up in the analysis.

The purpose of this post has been to document the processing steps we’re taking with ATNIX, from the raw yourTwapperkeeper data to our analysis using Tableau. As we’re completing the transition to this setup, I’ll also soon start to post some more or less regular ATNIX analysis updates again. Down the track, I’m also hoping to compare the Australian patterns with similar data we’ve been gathering for Germany, Norway, and Sweden for some time now – and to examine how newssharing on Twitter in Australia compares with news engagement patterns on Facebook, and more general patterns of access to Australian news sites. More to come!

Call: QUT Creative Industries Faculty PhD Scholarships for 2015 Entry

Join the QUT Social Media Research Group! Applicants with excellent academic track records (equal to an Australian Bachelor Degree with First Class Honours) or equivalent professional research experience may be eligible for competitive PhD scholarships to undertake study in the Creative Industries Faculty at QUT. The Faculty is also offering a number of top-ups to these scholarships for highly ranked students whose projects align with our areas of strength.

The Creative Industries Faculty’s world class, industry-connected researchers undertake innovative applied and theoretical research in the media, creative arts and design, and QUT is home to some of the world’s best researchers in digital media, communication and culture, given the highest possible rating of 5 in both the 2010 and 2012 ERA rankings.

QUT’s Social Media Research Group is a global leader in social media research, and one of the main contributors to the University’s strength in Digital Media overall. Supported by several major research grants and strategic collaborations with industry, QUT researchers are investigating the use of social media in crisis communication, in news and politics, as a backchannel to television and other media, and in everyday life. We are leading methodological innovation by exploring the uses of ‘big data’ for studying major social media platforms, by integrating STS and software studies into our approaches to social media platforms, as well as by developing novel mixed-methods approaches that support critical and interpretative analysis.

We are seeking new PhD students to investigate topics such as:

  1. The practices of sharing and engaging with mainstream media content through social media;
  2. the history and political economy of social and mobile media platforms;
  3. approaches to geomedia research, including locative and geosocial media;
  4. the structures and effects of follower networks in Australian social media spaces, using social network analysis methods;
  5. the consequences of emerging online platforms on the production and consumption of culture;
  6. new methods to generate quantitative metrics that describe activity patterns in social media datasets;
  7. agent-based simulation approaches for the analysis of networked co-creation of culture;
  8. critical and interpretive approaches to user engagement and evaluation practices;
  9. cross-platform flows of media content, data and cultural practices;
  10. uses, meanings and implications of mobile relationship and dating apps;
  11. the making and circulation of gender and sexuality with networked media.

Potential supervisors include:

If you are interested in applying, please contact Axel Bruns a.bruns@qut.edu.au or Jean Burgess je.burgess@qut.edu.au, in addition to following the processes below.

How to Apply

Information on the University’s Annual Scholarship Round can be found here.

Closing date: 30th September 2014 (earlier enquiries strongly encouraged).

Further information about the Faculty’s research can be found here.

Looking for a supervisor? Please view our Academic Staff profiles here.

Any Questions?

Contact the Creative Industries Faculty HDR support team at ci.hdr@qut.edu.au or phone +617 3138 3799 or 3138 8591.

First Steps in Exploring the Australian Twittersphere

Twitter is widely used in Australia, but we don’t actually know such a great deal about the structure and dynamics of the Australian Twittersphere. Back in 2011/12, our research began to identify Australian Twitter users and map their follower/followee connections in order to develop a better understanding of the structure of the network and from this determine some of the key themes and topics driving activity in the Australian Twittersphere, and we’re currently in the process of substantially extending this work. In this post I’m starting to share some first findings from this work.

Methods

First things first: here’s our methodology for getting to this point. Over the course of several months in 2013, the tools developed by our data scientist Troy Sadkowsky used the Twitter API to access the publicly available profile information for each account then in existence; we simply pinged every user ID from 0 through to (at that point) upwards of 2 billion, and recorded the information returned. This resulted in data for some 750 million accounts – the size of the global Twitter userbase (or more precisely, account base) around September 2013. (We’ll share some analysis of the global trends in Twitter account sign-ups in a separate post in the near future.) This comprehensive snapshot of global Twitter accounts provides us with an opportunity to go looking specifically for Australian users. To do so, we drew on three key elements of each user profile: the free-text profile description and location fields as entered by the account creator, as well as the profile timezone they chose from the pull-down menu of presets offered by Twitter. On the basis of the latter, we selected all users who had chosen one of the eight state-based Australian timezone options, while for the former two fields, we developed a long list of search terms relating to Australian towns, cities, and states, and to Australia itself, using a number of common variations. Any account that matched our criteria for “Australianness” in any of these three fields has been included in our selection. To go through the full list of search terms would take up another post, but we worked with a list of the 50-odd largest cities in Australia, added in a handful of popular variations, included the state names and their abbreviations, and also used terms such as “Australia”, “Stralya”, “down under”, and others. Following a test run, we further refined these terms, to include popular misspellings (“Austalia”, “Tasmainia”) and remove false positives. This turned out to be a somewhat time-consuming exercise: many place names in Australia are re-used from Europe (“Perth”, “Ipswich”) or duplicated in other new world countries (Brisbane, California; Victoria, British Columbia); some Australian place names also appear in popular media (some users claim to be from the “City of Townsville” or indeed the “Ciudad de Townsville” in homage to the Powerpuff Girls, or from Finding Nemo’s “42 Wallaby Way, Sydney”). Where possible we’ve filtered out any false positives which could be clearly identified. In the end, this process of filtering the total dataset of over 750 million Twitter accounts left us with some 2.8 million accounts whom we are confident to classify as ‘Australian’ for the purposes of this study. For many of these, we are also able to assign a likely state and/or city, based on which of our search terms helped identify the account; here, we give greatest credence to the information contained in the location field of the Twitter profile, followed by description and timezone. Where we identified users only based on their timezone, we have assigned a state, but have refrained from assigning them to the state’s capital city. Inevitably, some false positives will remain in our dataset, and some accounts will be miscategorised – “Sydneysider now living in Melbourne” or “Australian in New York” may lead to false location assignments, and descriptions like “Korean student in Brisbane” or even “Dreaming of travelling through Australia” would have matched our search terms, but do not relate to the accounts of Australian users in a narrow sense. However, given the size of the total dataset our best-match approach using automated processes is the best option available to us, and I’d guess that some 90-95% of the accounts we’ve matched are genuine Australian users: either Australians in Australia, Australians elsewhere in the world, or non-Australians living in Australia. The outliers from this population are likely to show up in our further analysis, too. There will also be some false negatives, of course: accounts which give no indication of their Australian connections anywhere in their location, description, or timezone details (including users who have filled in none of their profile details at all). It seems likely that the greatest number of these will be amongst the most recently registered accounts (whose owners may not yet have had a chance to fully customise their Twitter settings), so we’ll largely ignore this group for now – we’ll re-run our survey of the total Twitter userbase at some point in the future to examine how these accounts may have developed, as well as to gather data on the accounts which were created after our initial data-gathering exercise finished in September 2013.

Findings

By the end of August 2013, then, the Australian Twittersphere included some 2.79 million accounts, by our criteria. Per capita, using the Australian Bureau of Statistics’ figures for September 2013, this would translate to a 12% sign-up rate, though that figure must be viewed with some caution: some Twitter users will operate multiple accounts (e.g. for private and professional use), while in other cases several users will share the same group account. This is why we’re careful here to speak of 2.79 million accounts, rather than users. This figure is in line with existing reports and guesstimates for the size of the Australian Twittersphere, if somewhat below the 4 million Australian accounts that Twitter, Inc. itself apparently boasted some months ago. Figures from the company itself should always be taken with a grain of salt, of course; they’re largely released for corporate promotion reasons, and may well reflect the total number of Australian-based accounts ever created, rather than the number of accounts which are still in existence at present (which is what we measured). On the other hand, there is also an unknown number of accounts which our methods would not identify as Australian, based on publicly available profile details, but which Twitter, Inc. (which would have identified the IP address from which a Twitter account was created) would classify as Australian. This also explains some of the discrepancy in numbers. Here’s how that population has grown month by month over the seven years covered by our dataset (click on the images for larger versions): Australian Twitter Accounts From a slow start over the first couple of years (which is similar outside of Australia, too), there’s finally a sudden and rapid rise in new registrations per month in early 2009, peaking at over 100,000 new account registrations each in March and April 2009. (And there may well have been more than this: the 100,000+ accounts we see joining in these months are only those which were still in existence when we gathered our data in late 2013, of course.) From this early excitement, things slow down considerably towards the end of 2009 – and then trends start to point upwards again: the average number of new accounts joining per month during the following years is somewhere around 40-50,000. Finally, there is a substantial increase in new registrations in August 2013; this may be partly related to the impending federal election, but probably also reflects the fact that Twitter’s spam bot-checking systems may not yet have had a chance to remove any offending new accounts. We should also note, though, that what our data cannot (yet) tell us is the number of accounts which are being deleted each month, and how those deletions compare to the influx of new accounts. We’ll have a better indication of this after the next iteration of our survey, which will allow us to examine the discrepancies between the two datasets: accounts present in the September 2013 dataset but absent from the new iteration must have been deleted (by their owners, or by Twitter, Inc.) in the meantime. State-by-state patterns vary quite considerably at times. There are unusual spikes in ACT and Queensland account registrations between April and September 2012, for example which do not appear to be motivated by specific local events; ACT sign-ups per month rise from below 1,000 to over 4,000 accounts during that period, for example. From a preliminary review of the accounts which joined during that time, it appears that a considerable number of them belong to fans of The Janoskians, One Direction, and other teen bands, so perhaps there was a concerted effort by some of these bands to get their fans on Twitter? Australian Twitter Accounts (by State) Other spikes are clearly driven by more sinister motives. The large spike in generically ‘Australian’ accounts in January 2013 is caused almost entirely by a large number of spam bots being created at virtually the same time, for example: of the 1,106 new accounts on 16 January 2013 alone, we counted 170 accounts claiming to be “Australia’s support member for the Global Information Network”; 153 offering “Australian Business for Sale listings”; 155 promoting “software and services in Singapore. Australia. China and Japan”; and 164 accounts claiming to be an “Independent Mortgage Broker in Australia” – that’s almost two thirds of the ‘Australian’ accounts for that day. Clearly Twitter’s spam account filters still have some way to go. But genuine events in the world also result in increased sign-ups. During the first quarter of 2011, for example, we see a considerable spike in new Queensland-based accounts on 11 and 12 January, as floodwaters threaten inner-city Brisbane, and during the following days; in Victoria, New South Wales, and other states the sign-up rate also increases notably. Similarly, as a devastating earthquake hits Christchurch, New Zealand, on 22 February, Australians also sign up in larger numbers than usual. The pattern does not repeat (other than perhaps in Queensland, once again) following the 11 March earthquake and tsunami on the east coast of Japan, however. Australian Twitter Accounts (Q1-2011) The graph above also shows a considerable dip in new registrations on 18 February 2011 – this may well be due to an outage in Twitter’s account registration systems. The geographical distribution of these accounts should necessarily be treated with a certain degree of caution, given the vagaries of correctly identifying cities and states from the free text provided by users in the location and description fields. However, the patterns we’re able to determine from our best guess at the likely location of each user do reflect both the overall distribution of the Australian population and the relative likelihood (based on infrastructural and socioeconomic factors) of local residents joining Twitter that we would expect to see: Australian Twitter Accounts (geo) The major population centres are clearly leading the way. Sign-up rates per capita seem to be strongest in the state capitals and on the Gold Coast, but this may be an artefact of our approach, which focussed on identifying mentions of the 50-odd major population centres in Australia in the location and description fields of users’ Twitter profiles. Because of the greater national and international recognition of such centres, city users may state that they’re from state capitals while those from small rural and regional locations might just mention their state. In a further iteration of our work, we’ll check against a longer list of localities in Australia, and the patterns may well change. We’re on more solid ground when we examine the sign-up rates for each state. This aggregates users who name specific cities with those who only specify a state, and accounts for some 2.4 million of our total 2.8 million identified accounts – about 420,000 accounts we identified as ‘Australian’ referenced only generic terms (“Australia”, “down under”, etc.), but did not include any more specific location details. Australian Twitter Accounts (State and City) For most states, the sign-up rate ranges between 8 and 11 per cent, with Queensland and (perhaps somewhat surprisingly) the Northern Territory taking the lead of this group. There are likely to be any number of factors which have resulted in these slight differences in Twitter adoption across the country; for Queensland, for example, the well-publicised utility of Twitter during recent natural disasters may well have contributed to an above-average take-up. If the 420,000 accounts which we could not allocate to any specific state were distributed proportional to the states’ population figures, this would boost each sign-up rate by another 1.8 percentage points, incidentally. But the major story here is of course the ACT, which records a whopping per capita take-up rate of 30%. We’ll have to look more closely into what factors are responsible for this pattern – but so far we have not seen any indications that an unusually large number of false positives have slipped through our net. There are, however, unusually many accounts whose only identifying feature is their ACT timezone setting, and it is always possible that people from other UTC+10 timezones (for example in the northern hemisphere) might have chosen the ACT timezone rather than searching for their own options in the pull-down menu available on the Twitter site. Another factor that might drive the abnormally high number of accounts with some relation to the ACT is a combination of the socioeconomic make-up of the ACT population, and the fact that (as the seat of the federal government) there will be a very substantial number of organisational accounts, politicians, journalists, public servants, and other likely Twitter adopters in Canberra and surrounds. Additionally, there may also be a significant discrepancy between the number of formally registered ACT residents and the number of people who actually live and/or work in Canberra at least part of the time. If we break down state numbers per city, the capital cities unsurprisingly account for the majority of Twitter accounts. There are also many accounts for which a city couldn’t be determined – these are accounts which merely chose an Australian timezone, which named only their state in the location or description field, or which stated a location other than the 50-odd most populous Australian cities we searched for. Further, though, it is also notable that Queensland’s Twitter population appears to be most geographically dispersed: in addition to the Gold Coast (which is a major population centre in its own right, of course), it also boasts the widest range of other centres with Twitter userbases numbering above 1,000 accounts. This is largely reflecting the population distribution across various regional centres in central and far north Queensland, but may also point to the useful role Twitter now regularly plays during Queensland’s summer storm season. So much for a first overview of the overall figures. Over the next months, we’ll delve much more deeply into the patterns which this massive dataset of Australian Twitter accounts reveals – and we’ll also develop a number of approaches to mapping the follower/followee networks of this Twitter population.

Video of our talk at the University of Göttingen now available

Last month Axel, Darryl Woodford and I visited the University of Göttingen’s Centre for Digital Humanities as part of a two-year, ATN-DAAD funded collaboration. During our visit, we participated in a public workshop on Twitter and network analysis. Here is the video of our public talk, which touches on broader issues around digital methods and the challenges of analysing social media (slides and other information are available from the GCDH website).

Hashtag as hybrid forum: the case of #agchatoz

I’m posting this from the University of Amsterdam, where we are now well into the final day of a fantastic three-day conference called Social Media and the Transformation of Public Space. We have quite a gang of participants here from the QUT Social Media Research Group, and we’ll collect all our papers up and post them over at that website soon, but in the meantime here are the slides and notes from my paper (co-authored with Theresa Sauter). It’s the first public outing of new work I’ve been doing in collaboration with Theresa and also Anne Galloway, which will come out in due course as part of a book project that Nathan Rambukkana is putting together for Peter Lang (the book has the working title ‘Hashtag Publics’).

Speaker Notes

Introduction
This paper proceeds on the basis that contemporary publics are emergent – that is, they are constituted through their involvement with mediated issues and events, rather than pre-existing as a ‘public sphere’ (Marres, 2012; Warner, 2005). Digital media platforms and practices are influencing both the nature of such publics and the means through which they engage in issues (Papacharissi, 2010; Bruns & Burgess, 2011); at the same time, digital methods present significant new opportunities, not only to understand but also to improve this situation (Rogers, 2013).

Hashtag studies
Hashtags are often used to focus empirical research on the dynamics of public communication in Twitter, on a range of traditional topics extending from elections to natural disasters and television audiences (Bruns & Burgess, 2011; Bruns & Stieglitz, 2012; Deller, 2011). Indeed, the current proliferation of data-driven research on Twitter within media & communication studies has led to a saturation of what we might call ‘hashtag studies’.

… While the choice to focus on hashtag-based discussions has largely been driven by a combination of methodological convenience and the constraints on access to Twitter data,

there is still room to consider the performative role of the hashtag in materially shaping and coordinating public communication on specific issues, within and across social media platforms. However, most of the scholarship on hashtags has considered them as mere communicative markers.

SO: Hashtags enable, shape and coordinate the emergence, connectivity and mutual awareness of ad hoc publics (see also Bruns and Burgess 2011) outside of their participants’ individual networks of followers.

Bruns and Stieglitz (2011) differentiate between three different types of hashtags: ad hoc ones, which emerge “in response to breaking news or other unforeseen events”; recurring ones, which users employ to contribute repeatedly to a certain topic (such as the #agchatoz which we investigate in this chapter); and praeter hoc ones, which relevant organisations predetermine and encourage users to adopt when tweeting about a particular event, such as a conference or TV show.

Bruns and Moe (2013) further distinguish between topical and non-topical hashtags. They suggest that topical hashtags are used to contribute to a discussion on a particular topic. These can be long-standing themes (e.g. #auspol), backchannels to TV events (e.g. #masterchef) or reactions to particular issues or events (#royalwedding). Non-topical hashtags are emotive markers, such as #facepalm or #fail and can be applied to any type of tweet. Hashtags are highly generative, malleable and replicable in cultural terms.

Hashtags as hybrid forums
This paper focuses specifically on how some (but not all) hashtags can be understood as what Michel Callon, in the context of technology and society, has called ‘hybrid forums’:

Forums because they are open spaces where groups can come together to discuss technical options involving the collective, hybrid because the groups involved and the spokespersons claiming to represent them are heterogeneous, including experts, politicians, technicians, and laypersons who consider themselves involved. They are also hybrid because the questions and problems taken up are addressed at different levels in a variety of domains. (Callon, Lascoumes & Barthe, 2001:18)

Here, in exploring the possible forms and forums of ‘technical democracy’ e.g. in relation to nuclear power or genetically modified food, Callon is discussing rather more formalised and more recognisably institutional spaces – indeed the traditional institutions and fora of democracy – than social media, but this is precisely where digital methods applied to social media platforms have much to offer.
To this definition, we would add that they are also markedly hybrid today because they take place within a complex media environment centred around social media platforms, whose volatile dynamics, material features and competing business models also need to be taken into account.

#agchatoz
The case study for this paper is #agchatoz, a persistent and recurring Twitter hashtag with at least some of the characteristics of a ‘hybrid forum’ understood in this way. A local variant on the original US-based #agchat farmer advocacy or “agvocacy” Twitter community, #agchatoz originally had a mission to “raise the profile of Australian agriculture by shining a light on the leading issues that affect the industry and the wider community.” Weekly Twitter Q&A sessions use the #agchatoz hashtag to capture discussions of interest to the self-identifying agricultural community, ranging from personal issues such as succession planning and rural mental health, to work matters including sustainable farming methods and how to manage natural disasters, as well as more public concerns such as animal welfare and live export. Most discussions solicit a range of perspectives from producers, consumers, scientists, journalists and other professionals; sometimes discussions connect to other issues and their hashtags (like #banliveexport for the issue of animal welfare in the meat industry), thereby causing a collision of constituencies.

A survey of the most-shared URLs over six months on the hashtag gives an indication of the kinds of topical coverage. From agvocacy…

…including organised lobbying…

…to deliberative democratic engagement with high stakes environmental issues affecting farming and rural communities, like coal seam gas exploration…

…creating at times some counter-intuitive alliances between the urban left and the rural right….

…and even the Greens….

….while much of the tenor of the conversation frames the hashtag as an opportunity to bypass media stereotypes and have a voice in national debate, there is also a fair bit of antagonism towards a perceived uninformed city-dwelling culture who insufficiently value the role of agribusiness in Australia’s society and economy.

…and there are some dramatic collisions of opposing viewpoints and organised political groups on issues like animal welfare/animal rights.

…not to mention #felfies!

So #agchatoz, we argue, is a hybrid forum in the ways we described above, borrowing from and extending on Callon.
a generative site of speculative examples
a topical area not so familiar in media and communication studies, which tends to be more interested in politics, culture, and media in themselves
how can digital methods be used to discover issues and their publics, rather than researching already-known ones?

[refer here to the data slides, which for now have to more or less speak for themselves]

Conclusion
As we move forward with this project, digital methods combined with close regular observation allow us to go well beyond noting the loudest voices and dominant themes and attempt to trace the full diversity of stakeholder and non-stakeholder perspectives, substantive issues and topical diversions that come together within the #agchatoz forum. We argue that such an approach can help to tease out the complexity and diversity of issues of concern to and generative of publics. It is therefore important also to develop modes of performing such research in public, such that we reflexively and explicitly engage the publics forming around these issues.

References
Bruns, A. & Burgess, J. (2011). The use of Twitter hashtags in the formation of ad hoc publics. In 6th European Consortium for Political Research General Conference, 25 – 27 August 2011, University of Iceland, Reykjavik.

Bruns, A. and Moe, H. 2013. “Structural Layers of Communication on Twitter.” In Twitter and Society edited by K. Weller, A. Bruns, J. Burgess, M. Mahrt & C. Puschmann, 15-28. New York, NY: Peter Lang.

Bruns, A., & Stieglitz, S. (2012). Quantitative approaches to comparing communication patterns on Twitter. Journal of Technology in Human Services, 30(3-4), 160-185.

Callon, M., Lascoumes, P., Barth, Y. (2001). Acting in an Uncertain World. An Essay on Technical Democracy. MIT Press, Cambridge, Massachusetts; London, England. (Translated by Graham Burchell).

Deller, R. (2011). Twittering On: Audience Research and Participation Using Twitter. Participations 8(1). http://www.participations.org/Volume%208/Issue%201/deller.htm

Halavais, A. 2013. “Structure of Twitter: Social and Technical. ” In Twitter and Society edited by K. Weller, A. Bruns, J. Burgess, M. Mahrt & C. Puschmann, 29-42. New York, NY: Peter Lang.

Marres, N. (2012). Material Participation: Technology, the Environment and Everyday Publics. London: Palgrave.

Papacharissi, Z. (2010). A private sphere: Democracy in a digital age. Cambridge: Polity Press.

Rogers, R. (2013). Digital methods. Cambridge, MA: MIT Press.

Ruppert, Evelyn, John Law and Mike Savage. 2013. “Reassembling Social Science Methods: The Challenge of Digital Devices.“ Theory, Culture & Society 30(4): 22-46.

Warner, M. (2005). Publics and Counterpublics. Cambridge, MA.: MIT Press.

Layers of Communication on Twitter

If you’ve been wondering about the lack of news on this site – yes, we’re still here, and if we haven’t posted since the start of the year it’s because behind the scenes we’ve been busy preparing for a number of major new research projects that are about to start, as well as crunching some very big datasets. We’ll start posting a series of updates about these new developments over the coming month.

For the moment, though, here’s my first conference presentation for 2014, from the Media Talk symposium at Griffith University in Brisbane. I used this to work through the three layers of communication on Twitter which Hallvard Moe and I have identified in our chapter in Twitter and Society, and to provide some examples for how these layers operate in practice.

Layers of Communication: Forms of Talk on Twitter