I’ve just published an article about our first few weeks of ATNIX results over at The Conversation – but here, we’re already pushing ahead with the next week’s index. This one, I’m afraid, suffers from ‘difficult fourth week’ syndrome, though: we collect our data using a server based at the fabulous NeCTAR initiative, a shared cloud-based server infrastructure for Australian researchers. NeCTAR is a very welcome project, but still suffers from some teething problems – and over the past week our server became unresponsive on several days, resulting in gaps in our data gathering.
To complicate things a bit further, the Twitter data gathering tool which we use for most of our work, yourTwapperkeeper, is able to fill in some of the missing data after a restart by searching for recent tweets through the Twitter API – but this works reliably only for relatively low-volume search terms. What this means is that the different sites we’re tracking are differently affected by these outages: for the minor news and opinion sites, yTK will have been able to plug the gaps relatively easily, by retrieving the few dozen tweets which passed it by during a server outage lasting a few hours; for major news sites such as the Sydney Morning Herald or the ABC, however, the volume of tweets per hour is simply too large to go back and find all the tweets we might have missed.
So, take this week’s ATNIX Twitter news circulation results with a grain of salt, especially for the leading sites – we’ll be systematically undercounting their prominence this time around. We hope to have addressed these issues now, so that there won’t be a re-occurrence of these problems in future weeks.
Standard background information: this analysis is based on tracking all tweets which contain links pointing to the URLs of a large selection of leading Australian news and opinion sites. For technical reasons, it does not contain ‘button’ retweets, but manual retweets (“RT @user …”) are included. Datasets for those sites which cover more than just news and opinion (abc.net.au, sbs.com.au, ninemsn.com.au) are filtered to exclude irrelevant sections of those sites (e.g. abc.net.au/tv, catchup.ninemsn.com.au). For our analysis of ‘opinion’ link sharing, we include only those sub-sections of mainstream sites which contain opinion and commentary (e.g. abc.net.au/unleashed, articles on theaustralian.com.au which include ‘/opinion’ in the URL), and compare them with dedicated opinion and commentary sites.
See the posts tagged ‘ATNIX’ on this site for a full collection of previous results.
ATNIX Week 28: 9-16 July 2012
In total, we gathered some 134,000 tweets containing links to our tracked sites this week; if past weeks are any guide, that’s somewhere between 6,000 and 26,000 tweets which we’ve missed due to our server issues. The marketshare overview for news sites clearly shows that this data loss affects mainly the leading, most frequently shared news sites:

When normally, the Sydney Morning Herald receives some 20% of all the links to news sites, this week that percentage drops down to 16% – not because readers are turning away from the SMH, but because we missed a good chunk of those tweets. The same is true for ABC News and some of the other news leaders, while data for the lesser news sites will have been less affected by our outages. That said, it’s also worth noting that in spite of these problems, the top of the leaderboard has remained stable for yet another week – we’re seeing a picture of some very well-entrenched user loyalty emerge here.
Amongst opinion and commentary sites and sections, there’s a similar shrinkage of the leaders’ marketshare which is likely to be due to our technical problems rather than any inherent changes in user habits:

Here, though, we do also see some of the more fluid ranking which we’ve already observed over the past few weeks: the opinion sections of The Age, and blogs.news.com.au, drop several spots, while other sites increase their relative prominence. And as in previous weeks, some of the minor sites chalk up a handful of individual points – so, for example, the normally rather dormant Courier-Mail opinion section had a big winner on 10 July with a piece arguing against the common talking point that Julia Gillard ‘lied’ about carbon pricing before the 2010 election. On most days, the paper’s opinion pieces are lucky to receive a double-digit number of tweets mentioning them; that day, it came in at just above 100 tweets.
Daily Patterns, Weeks 25-28/2012
This brings us to the daily patterns – and here, the impact of our outages becomes most obviously apparent (I’ve shaded the problem days in grey in the graphs below):

The top five or six news sites, in particular, are strongly affected by our technical problems; their daily share of link circulation on 11-15 July is nowhere near where we’d come to expect it to be based on the previous weeks’ results. From the Daily Telegraph onwards, though, relative levels of visibility are about where we’d expect them to be – here, yourTwapperkeeper’s ability to back-fill data it missed seems to have made up for most of those outages.
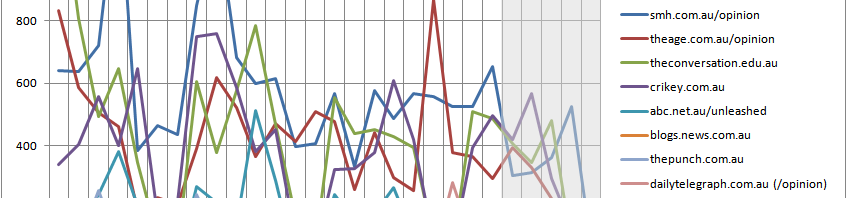
The same is true for opinion and commentary links:

While levels for week 28 aren’t that far away from the previous week, it should be noted that week 27 was an unusually slow week for opinion pieces. Next time around, we should expect to see those figures rise again by some margin, I should think – and we’re very much hoping not to see a repeat of our server issues then…